How To Use R
1 Introduction
This tutorial is a basic introduction to R that was originally written for biologists to get a basic understanding of how R functions. R is a software package that is a free to use open-source version of the S programming language. It is designed mainly for running statistical analyses and is very powerful in this regard. Follow through the tutorial and run the example commands by typing them into the command line as you go to see what happens. Don’t be afraid to play around with things as you go – it’s the best way to find out what certain functions do.
You will notice that I have added comments to some of the code using the # comment character. Everything to the right of this character is ignored by R. This can be used to add comments to your code, for instance to explain what a particular code chunk does. You can NEVER have too many comments!
2 Installing R
First of all, you will need to download and install R. The R website can be found at r-project.org. R is updated quite regularly – there is an updated release roughly every 6 months, with various developmental versions released between the official versions. The functions in R are actively maintained to ensure that they run as they should, and new functionality is added all of the time.
The current version is 3.3.2. To download it, go to the Comprehensive R Archive Network (cran.r-project.org). There are ready-made binaries available for MAC, windows, and most Linux distributions, so follow the links and download as instructed. You can also download the source code in a tarball, and can compile and install it using make.
It is also worth taking a look at the Integrated Development Environment RStudio, which is a great open-source interface for R.
3 Basics of R
3.1 Introduction
Open the R environment. This is a command line version allowing you to see the results of the commands that you enter as you run them.
The command line is shown by the > character. Simply type your command here and press return to see the results. If your command is not complete, then the command line character will change to a + to indicate that more input is required, for instance a missing parenthesis:
print ("Hello World!"## Error: <text>:2:0: unexpected end of input
## 1: print ("Hello World!"
## ^R stores “variables” using names made up of characters and numbers. A variable, as the name suggests, is a data “object” that can take any value that you want, and can be changed.
The variable name can be anything that you like, although it must begin with a character. Whilst it is perfectly acceptable to use simple variable names such as x, y, i, I recommend using a more descriptive name (e.g. patient_height instead of x). There are lots of different variable naming conventions to choose from (e.g. see here), but once you have chosen one try and stick to it.
To assign a value to the variable, use the <- command (less-than symbol followed by minus symbol). You can also use the = symbol, but this has other uses (for instance using == to test for equality) so I prefer to use the <- command:
x <- 3
x # Returns the value stored in 'x' - currently 3
## [1] 3x <- 5
x # Returns the value stored in 'x' - now 5## [1] 5Simple arithmetic can be performed using the standard arithmetic operators (+, -, *, /), as well as the exponent operator (^). There is a level of precedence to these functions – the exponent will be calculated first, followed by multiplication and division, followed by plus and minus. For this reason, you must be careful that your arithmetic is doing what you expect it to do. You can get around this by encapsulating subsets of the sum in parentheses, which will be calculated from the inside out:
1+2*3 ## [1] 7(1 + 2) * 3 ## [1] 91 + (2 * 3) ## [1] 7Personally I think that you can NEVER have too many parentheses – they ensure that your equations are doing what they should, and they can help improve the readability of things making it easier to see what a calculation is trying to achieve.
Another operator that you may not have seen before is the “modulo” operator (%%), which gives you the remainder left after dividing by the number:
6%%2 # 6 is divisible by 2 exactly three times## [1] 06%%4 # 6 is divisible by 4 one time with a remainder of 2## [1] 2You can also use other variables in these assignments:
x <- 1
y <- x
y
## [1] 1z <- x + y
z## [1] 23.2 Data Classes
Variables can take many forms, or “classes”. The most common are “numeric” (which you can do numerical calculations on), character (can contain letters, numbers, symbols etc., but cannot run numerical calculations), and logical (TRUE or FALSE). The speech marks character " is used to show that the class of y is “character”. You can also use the apostrophe '. There is a difference between these, but for now this is not important. You can check the class of a variable by using the class() function:
x <- 12345
class(x)
## [1] "numeric"y <- "12345"
class(y)## [1] "character"Addition is a well-defined operation on numerical objects, but is not defined on character class objects. Attempting to use a function which has not been defined for the object in question will throw an error:
x + 1 # x is numeric, so addition is well defined## [1] 12346y + 1 # y is a character, so addition is not defined - produces an error## Error in y + 1: non-numeric argument to binary operatorTo see which objects are currently present in the R environment, use the ls() command. To remove a particular object, use the rm() command. BE CAREFUL – once you have removed an object, it is gone forever!
x <- 5
ls ()
## [1] "x" "y" "z"rm(x)
ls ()## [1] "y" "z"rm(list=ls()) # Removes all objects in the current R session
ls ()## character(0)You can also change the class of a variable by assigning to the class() function:
x <- "12345"
x+1
## Error in x + 1: non-numeric argument to binary operatorclass(x)## [1] "character"class(x) <- "numeric"
class(x)## [1] "numeric"x+1## [1] 12346The other important data class is “logical”, which is simply a binary TRUE or FALSE value. There are certain operators that are used to compare two variables. The obvious ones are “is less than” (<), “is greater than” (>), “is equal to”" (==). You can also combine these to see “is less than or equal to” (<=) or “is greater than or equal to” (>=). If the statement is true, then it will return the output “TRUE”. Otherwise it will return “FALSE”:
x <- 2
y <- 3
x <= y
## [1] TRUEx >= y## [1] FALSEYou can also combine these logical tests to ask complex questions by using the “AND” (&&) or the “OR” (||) operators. You can also negate the output of a logical test by using the “NOT” (!) operator. This lets you test for very specific events in your data. Again, I recommend using parentheses to break up your tests to ensure that the tests occur in the order which you expect:
x <- 3
y <- 7
z <- 6
(x <= 3 && y >= 8) && z == 6
## [1] FALSE(x <= 3 && y >= 8) || z == 6 ## [1] TRUEOne important set of functions are the log and exponential functions. The exponential function is the function \(e^x\), such that \(e^x\) is its own derivative (\(\frac{d}{dx} e^x = e^x\)). The value e is the constant 2.718281828…, which is the limit \(\lim_{n \to \infty} (1+\frac{1}{n})^n\). It is a very important value in mathematics (hence why it has its own constant). Logarithms are the inverse of exponents, with natural log being log base \(e\). Here are some examples:
log (8) ## Natural logarithm - base e## [1] 2.079442log2 (8) ## Log base 2## [1] 3exp (1) ## e## [1] 2.718282exp (5) ## e^5## [1] 148.4132log(exp(8)) ## log and exponential cancel out - base e## [1] 8exp(log(8)) ## log and exponential cancel out - base e## [1] 82^(log2(8)) ## log and exponential cancel out - base 2## [1] 8log2 (2^8) ## log and exponential cancel out - base 2## [1] 83.3 Vectors
Single values are all well and good, but R has a number of ways to store multiple values in a single data structure. The simplest one of these is as a “vector” – simply a list of values of the same class. You create a vector by using the c() (concatenate) function:
my_vector <- c(1,2,3,4,5)
my_vector
## [1] 1 2 3 4 5This is a very useful way of storing linked data together. You can access the individual elements of the vector by using square brackets ([) to take a subset of the data. The elements in the vector are numbered from 1 upwards, so to take the first and last values we do the following:
my_vector <- c(10,20,30,40,50)
my_vector[1]
## [1] 10my_vector[5]## [1] 50my_vector[6]## [1] NAAs you can see, a value NA (Not Applicable) is returned if you try to take an element that does not exist. The subset can be as long as you like, as long as it’s not longer than the full set:
my_vector <- c(10,20,30,40,50)
my_vector[1:4]
## [1] 10 20 30 40Here, the : in the brackets simply means to take all of the numbers from 1 through to 4, so this returns the first 4 elements of the vector. For instance, this is a simple way to take the numbers from 1 to 20:
1:20## [1] 1 2 3 4 5 6 7 8 9 10 11 12 13 14 15 16 17 18 19 20To drop elements from an array, you use the minus symbol:
my_vector <- c(10,20,30,40,50)
my_vector[-1]
## [1] 20 30 40 50my_vector[-length(my_vector)] ## [1] 10 20 30 40my_vector[-c(1,3,5)]## [1] 20 40Another way to generate a regular sequence in R is to use the seq() command. You supply the start number and the end number, and then either supply the parameter by to define the regular interval between values, or the parameter length to specify the total number of values to return between the start and end value:
seq(from = 1, to = 20, by = 1) # Returns the same as 1:20## [1] 1 2 3 4 5 6 7 8 9 10 11 12 13 14 15 16 17 18 19 20seq(from = 1, to = 20, by = 2) # Just the even numbers between 1 and 20 ## [1] 1 3 5 7 9 11 13 15 17 19seq(from = 1, to = 20, length = 10) # Slightly different to above## [1] 1.000000 3.111111 5.222222 7.333333 9.444444 11.555556 13.666667
## [8] 15.777778 17.888889 20.000000You can also use the rep() function to give a vector of the specified length containing repeated values:
rep(10, times = 5) # Returns vector containing five copies of the number 10 ## [1] 10 10 10 10 10rep(c(1,2,3), each = 5) # Returns five 1s, then five 2s, then five 3s## [1] 1 1 1 1 1 2 2 2 2 2 3 3 3 3 3One of the most powerful features of R is the fact that arithmetic can be conducted on entire vectors rather than having to loop through all values in the vector. Vectorisation of calculations in this way can give huge improvements in performance. For instance, if you sum two vectors (of equal size), the result will be a vector where the ith entry is the sum of the ith entries from the input vectors:
x <- c(2,3,2,4,5)
y <- c(4,1,1,2,3)
x+y
## [1] 6 4 3 6 8x*y## [1] 8 3 2 8 153.4 Lists
Another data structure that is very useful is the “list”. A list contains a number of things in a similar way to the vector, but the things that it contains can all be completely different classes. They can even be vectors and other lists (a list of lists):
my_list <- list(12345, "12345", c(1,2,3,4,5))
my_list
## [[1]]
## [1] 12345
##
## [[2]]
## [1] "12345"
##
## [[3]]
## [1] 1 2 3 4 5To subset a list, the syntax is slightly different and you use double square brackets:
my_list <- list(12345, "12345", c(1,2,3,4,5))
my_list[[1]]
## [1] 12345my_list[[3]]## [1] 1 2 3 4 5If your list contains lists or vectors, you can subset these as well by using multiple sets of square brackets:
my_list <- list(12345, "12345", c(1,2,3,4,5))
my_list[[3]][5]
## [1] 5Can you see the difference between subsetting using [[ and using [?
my_list <- list(12345, "12345", c(1,2,3,4,5))
my_list[[3]]  ## Returns a vector
## [1] 1 2 3 4 5my_list[3] ## Returns a list## [[1]]
## [1] 1 2 3 4 5my_list[3][5] ## Not defined!## [[1]]
## NULLYou can give names to the values in a vector or in a list by using the names() function to make it easier to follow what the values are:
my_vector        <- c(1:5)
names(my_vector) <- c("length", "width", "height", "weight", "age")
You can use these names instead of the reference number to subset lists and vectors:
my_vector        <- c(1:5)
names(my_vector) <- c("length", "width", "height", "weight", "age")
my_vector["age"]
## age
## 5The number of values in a vector or list can be found by using the length() function:
my_vector <- 1:5
length(my_vector)
## [1] 5We can also sort the data simply using the sort() function. If we want to get the indeces of the sorted vector (for instance to order a second vector based on the values in the first), we can use the order() function:
## Some values and their corresponding names
my_vals  <- c( 0.2, 1.7, 0.5, 3.4, 2.7 )
my_names <- c("val1", "val2", "val3", "val4", "val5")

## Sort the data
my_sorted <- sort(my_vals)  ## Returns the values in sorted order
my_order  <- order(my_vals) ## Returns the indeces of the sorted values

## What is the difference between the two?
my_sorted
## [1] 0.2 0.5 1.7 2.7 3.4my_order## [1] 1 3 2 5 4## Get the sorted value names
sort(my_names) ## This won't work as this will order names alphabetically ## [1] "val1" "val2" "val3" "val4" "val5"my_names[my_order] ## This gives us the order based on the values themselves## [1] "val1" "val3" "val2" "val5" "val4"By default the sort functions sort from lowest to highest. You can sort in decreasing by order by using the decreasing parameter:
sort(my_vals , decreasing = TRUE)## [1] 3.4 2.7 1.7 0.5 0.23.5 Matrices
Another data format is a “matrix”" (also known as an “array” in R). This is simply a table of values, and can be thought of as a multidimensional vector. To access specific values in the matrix, you again use the square bracket accessor function, but this time must specify both the row (first value) and column (second value):
my_matrix <- matrix(1:20, nrow = 5, ncol = 4)
my_matrix
## [,1] [,2] [,3] [,4]
## [1,] 1 6 11 16
## [2,] 2 7 12 17
## [3,] 3 8 13 18
## [4,] 4 9 14 19
## [5,] 5 10 15 20my_matrix[3,4] <- 99999
my_matrix## [,1] [,2] [,3] [,4]
## [1,] 1 6 11 16
## [2,] 2 7 12 17
## [3,] 3 8 13 99999
## [4,] 4 9 14 19
## [5,] 5 10 15 20By default, the values are added to the matrix in a column-wise fashion (from top to bottom for column 1, then the same for column 2, etc.). To fill the matrix in a row-wise fashion, use the byrow parameter:
my_matrix <- matrix(1:20, nrow = 5, ncol = 4, byrow = TRUE)You can also use the square bracket accessor function to extract subsets of the matrix:
my_matrix <- matrix(1:20, nrow = 5, ncol = 4)
my_matrix
## [,1] [,2] [,3] [,4]
## [1,] 1 6 11 16
## [2,] 2 7 12 17
## [3,] 3 8 13 18
## [4,] 4 9 14 19
## [5,] 5 10 15 20sub_matrix <- my_matrix[1:2, 3:4]
sub_matrix## [,1] [,2]
## [1,] 11 16
## [2,] 12 17The cbind() (column bind) and rbind() (row bind) functions can also be used to concatenate vectors together by row or by column to give a matrix:
cbind(c(1,2,3), c(4,5,6), c(7,8,9)) ## [,1] [,2] [,3]
## [1,] 1 4 7
## [2,] 2 5 8
## [3,] 3 6 9rbind(c(1,2,3), c(4,5,6), c(7,8,9)) ## [,1] [,2] [,3]
## [1,] 1 2 3
## [2,] 4 5 6
## [3,] 7 8 9You can change the names of both the rows and the columns by using the rownames() and colnames() functions:
my_matrix           <- matrix(1:20, nrow = 5, ncol = 4)
rownames(my_matrix) <- c("row1", "row2", "row3", "row4", "row5")
colnames(my_matrix) <- c("col1", "col2", "col3", "col4")
my_matrix
## col1 col2 col3 col4
## row1 1 6 11 16
## row2 2 7 12 17
## row3 3 8 13 18
## row4 4 9 14 19
## row5 5 10 15 20The dimensions of the matrix can be found by using the dim() function, which gives the number of rows (first value) and the number of columns (second value) of the matrix. You can access the number of rows or columns directly by using the nrows() or ncols() functions respectively:
my_matrix <- matrix(1:20, nrow = 5, ncol = 4)
dim(my_matrix)
## [1] 5 4nrow(my_matrix)## [1] 5ncol(my_matrix)## [1] 43.6 Functions
R also uses functions (also known as methods, subroutines, and procedures) which simply take in one or more values, do something to them, and return a result. A simple example is the sum() function, which takes in two or more values in the form of a vector, and returns the sum of all of the values:
my_vector <- 1:5
sum(my_vector)
## [1] 15In this example, the sum() function takes only one variable (in this case a numeric vector). Sometimes functions take more than one variable (also known as “arguments”). These are named values that must be specified for the function to run. For example, the cor() function returns the correlation between two vectors. This requires several variables to be supplied – two vectors, x and y, of equal length – and you can also supply a number of additional arguments to control how the function works, including the method argument, which lets you specify which method to use to calculate the correlation:
sample1 <- c(0.9, 1.2, 8.9, -0.3, 6.4)
sample2 <- c(0.6, 1.3, 9.0, -0.5, 6.2)
cor(sample1, sample2 , method = "pearson")
## [1] 0.9991263cor(sample1, sample2 , method = "spearman")## [1] 1Note that we gave a name to the third argument (“method”), but not the first two. If you do not name arguments, they will be taken and assigned to the arguments in the order in which they are input. The first two arguments required by the function are x and y – the two vectors to compare. So there is no problem with not naming these (although you could, if you wanted to, say x=sample1, y=sample2). Any arguments not submitted will use their default value. For instance, the Pearson correlation is the default for method, so you could get this by simply typing:
pearson_cor <- cor(sample1 , sample2)However, there is another argument for cor(), use, for which we are happy to use the default value before we get to method. We therefore need to name method to make sure that “pearson”" is not assigned to the use argument in the function. It is always safer to name the arguments if you are unsure of the order. You can check the arguments using the args() function:
args(cor)## function (x, y = NULL, use = "everything", method = c("pearson",
## "kendall", "spearman"))
## NULLIf you want to find out what a function does, there is a lot of very helpful documentation available in R. To see the documentation for a specific function, use the help() function. If you want to try and find a function, you can search using a keyword by using the help.search() function:
help(cor)
?cor # Alternative for help()
help.search("correlation")
??correlation # Alternative for help.search()
3.7 Printing
print() can be used to print whatever is stored in the variable the function is called on. Print is what is known as an “overloaded”" function, which means that there are many functions named print(), each written to deal with a variable of a different class. The correct one is used based on the variable that you supply. So calling print() on a numeric variable will print the value stored in the variable. Calling it on a vector prints all of the values stored in the vector. Calling it on a list will print the contents of the list split into an easily identifiable way. There are also many more classes in R for which print is defined, but there are too many to describe here:
x <- 1
print (x)
## [1] 1y <- 1:5
print (y)## [1] 1 2 3 4 5z <- list(val1 = 1:5, val2 = 6:10)
print (z)## $val1
## [1] 1 2 3 4 5
##
## $val2
## [1] 6 7 8 9 10If you notice, using print() is the default when you just call the variable itself:
z <- list(val1 = 1:5, val2 = 6:10)
print (z)
## $val1
## [1] 1 2 3 4 5
##
## $val2
## [1] 6 7 8 9 10z## $val1
## [1] 1 2 3 4 5
##
## $val2
## [1] 6 7 8 9 10cat() is similar to print in that the results of calling it are that text is printed to the console. The main use for cat() is to conCATenate two or more variables together and instantly print them to the console. The additional argument sep specifies the character to use to separate the different variables:
cat("hello", "world", sep = " ") ## hello worldx <- 1:5
y <- "bottles of beer"
cat(x, y, sep = "\t")## 1 2 3 4 5 bottles of beer\t is a special printing character that you can use with the cat() function that prints a tab character. Another similar special character that you may need to use is \n which prints a new line.
Another similar function is the paste() function, which also concatenates multiple values together. The differences between this and cat() are that the results of paste() can be saved to a different variable which requires a call to print() to see the results, and paste() can be used to concatenate individual elements of a vector by using the additional collapse argument:
print(paste("hello", "world", sep = "\t"))## [1] "hello\tworld"print(paste("sample", 1:5, sep="_")) # Returns a vector of values## [1] "sample_1" "sample_2" "sample_3" "sample_4" "sample_5"print(paste("sample", 1:5, sep="_", collapse="\n")) # Prints values separated by new lines## [1] "sample_1\nsample_2\nsample_3\nsample_4\nsample_5"Do you notice the difference between print() and cat()? While print() prints the \t character as is, cat() prints the actual tab space. This is a process known as “interpolation”. In many programming languages, using double quotes in strings results in special characters being interpolated, whilst single quotes will print as is. However, in R the two can be used relatively interchangeably.
There are also other characters, such as ', ", / and \, which may require “escaping” with a backslash to avoid R interpreting the character in a different context. For instance, if you have a string containing an apostrophe within a string defined using apostrophes, the string will be interpreted as terminating earlier, and the code will not do what you expect:
cat('It's very annoying when this happens...')## Error: <text>:1:9: unexpected symbol
## 1: cat('It's
## ^Here, the string submitted to cat() is actual “It” rather than the intended “It’s very annoying when this happens…”. The function will not know what to do about the remainder of the string, so an error will occur. However, by escaping the apostrophe, the string will be interpreted correctly:
cat('It\'s easily fixed though!')## It's easily fixed though!Another alternative is to use double apostrophes as the delimiter, which will avoid the single apostrophe being misinterpreted:
cat("It's easily fixed though!")## It's easily fixed though!One function that gives you slightly more control over the formatting of your data is the sprintf() function. This function allows you to specify things like the width in which to print each variable, which is useful for arranging output in a table format (note that you need to use cat() to actual print to the screen):
cat(sprintf("%10s\t%5s\n", "Hello", "World"),
    sprintf("%10s\t%5s\n", "Helloooooo", "World"))
## Hello World
## Helloooooo WorldThe sprintf() function takes as input a string telling R how you want your inputs to be formatted, followed by a list of the inputs. Within the formatting string, placeholders of the form %10s are replaced by the given inputs, with the first being replaced by the first argument in the list, and so on (so the number of additional arguments to sprintf must match the number of placeholders). The number in the placeholder defines the width to allocate for printing that argument (positive is right aligned, negative is left aligned), decimal numbers in the placeholder define precision of floating point numbers, and the letter defines the type of argument to print (e.g. s for string, i for integer, f for fixed point decimal, e for exponential decimal). Note that special characters are interpolated by cat() as before. Here are some examples:
cat(sprintf("%20s\n", "Hello")) ## Hellocat(sprintf("%-20s\n", "Hello")) ## Hellocat(sprintf("%10i\n", 12345)) ## 12345cat(sprintf("%10f\n", 12.345)) ## 12.345000cat(sprintf("%10e\n", 12.345)) ## 1.234500e+014 Installing Packages
The main R package contains a large number of commonly used functions. There are also additional functions available in other “packages” that you can get hold of from the Comprehensive R Archive Network, or CRAN. To load in a package, first download and install the package from CRAN using the install.packages() function (if it is not already downloaded), and then use the “library” command to make the libraries available to your current R session:
?xtable ## No documentation for 'xtable' in specified packages and libraries:
## you could try '??xtable'install.packages("xtable")## Error in contrib.url(repos, "source"): trying to use CRAN without setting a mirrorlibrary("xtable")
?xtableThe function xtable() is not available in the R environment until you have loaded the package. Only the most commonly used functions are made available in the R environment by default (for example the package “stats” is loaded by default, which contains all commonly used statistical fuctions). There are also a number of commonly used packages that are part of the R installation, but which are not automatically loaded when you start a new R session. There are also thousands of additional packages available, some written by users, which can perform most of the things that you would ever want to do. Chances are, if you want to do something it’s already available from somewhere. Don’t re-invent the wheel if you can help it.
Since R is so useful for analysing biological data, the bioconductor project was set up to bring together packages used for the analysis of high-throughput data (it started with microarrays, but now there are packages available for analysis of sequencing data). Bioconductor packages can be downloaded from bioconductor.org. However, there is also a simple way to install bioconductor packages directly from within R:
source("http://bioconductor.org/biocLite.R") # Load the biocLite() script
biocLite() # Installs the basic packages required to use bioconductor
biocLite("DESeq") # Installs a specific bioconductor package
5 Data Frames
Data frames are the most powerful data types in R. They look similar to matrices, but the data structure is actually more similar to a list of vectors (all of the same length). The simplest way to think of them is as being similar to spreadsheets in Excel.
You can create data frames either in a similar way to how you create a list, or also by converting a matrix object:
data.frame(val1 = c(1:3), val2 = c(4:6), val3 = c(7:9), val4 = c(10:12)) ## val1 val2 val3 val4
## 1 1 4 7 10
## 2 2 5 8 11
## 3 3 6 9 12as.data.frame(matrix(1:12, nrow = 3, ncol = 4))## V1 V2 V3 V4
## 1 1 4 7 10
## 2 2 5 8 11
## 3 3 6 9 12Notice how, in the second data frame, no column names are specified so R sets the defaults as V1, V2, V3, etc. Whilst data frames do have row names, it is the column names that are the most important. As with lists, these can be changed by using the names() command:
my_df        <- as.data.frame(matrix(1:12, nrow = 3, ncol = 4))
names(my_df) <- c("val1", "val2", "val3", "val4")
my_df
## val1 val2 val3 val4
## 1 1 4 7 10
## 2 2 5 8 11
## 3 3 6 9 12You access the elements of a data frame either using single square bracket notation in the same way as for a matrix, or you can access the individual columns using double square bracket notation in the same way as for lists. You can also access the individual columns by using the special $ operator which is specifically used for data frames:
my_df <- as.data.frame(matrix(1:12, nrow = 3, ncol = 4))
names(my_df) <- c("val1", "val2", "val3", "val4")
my_df
## val1 val2 val3 val4
## 1 1 4 7 10
## 2 2 5 8 11
## 3 3 6 9 12sub_df <- my_df[1:2, 3:4]
sub_df## val3 val4
## 1 7 10
## 2 8 11val1 <- my_df[[1]]
val1## [1] 1 2 3val2 <- my_df[["val2"]]
val2## [1] 4 5 6val3 <- my_df$val3
val3## [1] 7 8 9The beauty of data frames is that the data frame columns can be dealt with as if they were individual variables. For this reason, the column names must be suitable variable names (i.e. alphanumeric and not starting with a number) and must be unique. If you attach a data frame, you can access the columns as if they were variables:
my_df <- data.frame(val1 = c(1:3), val2 = c(4:6), val3 = c(7:9), val4 = c(10:12))
attach(my_df)
## The following objects are masked _by_ .GlobalEnv:
##
## val1, val2, val3my_df## val1 val2 val3 val4
## 1 1 4 7 10
## 2 2 5 8 11
## 3 3 6 9 12val1 + 1000 ## [1] 1001 1002 1003detach(my_df)As a slight aside, I dislike using the attach/detach approach to accessing elements of a data frame, as it can make it difficult when reading through your code to tell which variable is being accessed. For instance, if you have a variable named myname, and a data frame with a column myname, then using df$myname in your code makes it much clearer where you are accessing your data from than simply using myname.
Notice that to make changes to the data frame itself, we need to use the $ accessor function (or double square brackets), otherwise a new variable val1 will be created. Data frames should be set up in such a way that every row represents an independent observation, and the columns represent the independent variables that you may be interested in. For instance, if you have taken a measurement of say the weight of each sample in triplicate, you would not represent the data like this:
| SampleName | Weight1 | Weight2 | Weight3 |
|---|---|---|---|
| Sample1 | 67.1 | 67.3 | 66.8 |
| Sample2 | 80.3 | 79.8 | 79.5 |
But instead you would ensure that the two independent variables (weight and replicate number) were in their own columns:
| SampleName | Replicate | Weight |
|---|---|---|
| Sample1 | 1 | 67.1 |
| Sample1 | 2 | 67.3 |
| Sample1 | 3 | 66.8 |
| Sample2 | 1 | 80.3 |
| Sample2 | 2 | 79.8 |
| Sample2 | 3 | 79.5 |
Now all of the weights are in a single column that can be analysed.
Subsetting a data frame is also very powerful. The subset command allows you to look for the rows of a data frame that fit certain criteria. For instance, to pull out the genes that show more than 2-fold expression and a p-value less than 0.05, you would do the following:
gene_exp <- data.frame(geneName   = paste("gene", 1:10, sep = ""),
                       foldChange = rnorm(10, mean = 2, sd = 1),
                       pVal       = rnorm(10, mean = 0.05, sd = 0.05))
signif_genes <- subset(gene_exp, foldChange > 2 & pVal <= 0.05)
signif_genes
## geneName foldChange pVal
## 10 gene10 2.16183 0.01985841Notice here that we use a single & rather than the double && that we used earlier. This is because we are doing a vector-based logical test (that is performing the test on each element of the vector to get a vector of logical values at the end). It is very easy to forget this and accidentally use the &&, which will not give you what you want:
fake_signif_genes <- subset(gene_exp, foldChange > 2 && pVal <= 0.05)
fake_signif_genes
## [1] geneName foldChange pVal
## <0 rows> (or 0-length row.names)Another form of data that comes in very handy, particularly with data frames, is the “factor”. Factors are a way of dealing with categorical data, and simply encode the possible levels with numberic dummy values 0, 1, 2, etc. (which are used in modelling procedures such as ANOVA):
my_vector <- c("apples", "pears", "apples", "oranges", "pears")
my_vector
## [1] "apples" "pears" "apples" "oranges" "pears"my_factor <- as.factor(my_vector)
my_factor## [1] apples pears apples oranges pears
## Levels: apples oranges pearslevels(my_factor)## [1] "apples" "oranges" "pears"Since data frames can hold data of different classes within its columns (a data frame is essentially a glorified list), it is very important to ensure that each column is assigned the correct class so that R functions that you use later do the correct thing with the data. For instance, R will automatically convert character entries to factors with all possible values as the factor levels. You can quickly see the class of all of your columns by using the str() function:
str(gene_exp)## 'data.frame': 10 obs. of 3 variables:
## $ geneName : Factor w/ 10 levels "gene1","gene10",..: 1 3 4 5 6 7 8 9 10 2
## $ foldChange: num 1.56 4.09 2.03 1.01 1.59 ...
## $ pVal : num 0.17 0.0956 0.0846 0.1082 0.015 ...Whilst factors are incredibly useful in modelling and plotting, they may not necessarily be exactly what you want. For instance, in this case the column geneName has been converted into a factor, with levels gene1, …, gene10. If we try and add in a new gene, gene11, this will not work as all entries of a factor must be one of the specified levels:
gene_exp_plus <- rbind(gene_exp, c("gene11", 1.789, 0.0034))## Warning in `[<-.factor`(`*tmp*`, ri, value = "gene11"): invalid factor
## level, NA generatedgene_exp_plus## geneName foldChange pVal
## 1 gene1 1.55502847283237 0.169996616953733
## 2 gene2 4.08918798442876 0.095575651141573
## 3 gene3 2.02919707185471 0.0846151633741764
## 4 gene4 1.00933996715189 0.108163281594829
## 5 gene5 1.5922906983306 0.015047922371659
## 6 gene6 1.61536587990071 0.0273177749720016
## 7 gene7 1.5488153175614 0.0452204763197195
## 8 gene8 2.1528224369134 0.0995226718729113
## 9 gene9 1.38621857664537 0.00265638125448632
## 10 gene10 2.16183028732056 0.0198584054174664
## 11 <NA> 1.789 0.0034Instead we would be better off treating geneName as a character vector, since we are unlikely to treat it as a categorical variable in later model fitting analyses.
6 Reading and Writing Data
Reading and writing data in R is quite simple, and is most easily done by using pure text files. Functions exist for reading other formats as well (e.g. Excel tables), but for now we will concentrate on raw text. There are some very basic example files available from here.
Unless you give the complete path for a file, R will look in it’s current working directory for any files that you want to load in. By default, R will use your system’s home directory, but you can set this by using the setwd() function. You can check that the correct working directory is set by using the getwd() function:
setwd("/path/to/mydir/")
getwd ()
If you have a list of data in a file (e.g. a list of gene names separated by new lines), then the simplest method to use is scan(). You must tell scan() where to find the data file (either the full path, or a relative path from the current working directory), as well as the format that the data should be read in as (generally either “character” or “numeric”):
my_file <- "gene_list.txt"
gene_list <- scan(my_file, what = "character", sep = "\n")
gene_list
## [1] "gene1" "gene2" "gene3" "gene4" "gene5" "gene6" "gene7"
## [8] "gene8" "gene9" "gene10" "gene11" "gene12" "gene13" "gene14"
## [15] "gene15" "gene16" "gene17" "gene18" "gene19" "gene20" "gene21"
## [22] "gene22" "gene23" "gene24" "gene25" "gene26" "gene27" "gene28"
## [29] "gene29" "gene30" "gene31" "gene32" "gene33" "gene34" "gene35"
## [36] "gene36" "gene37" "gene38" "gene39" "gene40" "gene41" "gene42"
## [43] "gene43" "gene44" "gene45" "gene46" "gene47" "gene48" "gene49"
## [50] "gene50"For tables (for instance tab-delimited files saved from Excel), the easiest way is to use the read.table() function. This works by using scan() to read in each line from the table, then splitting the line by the specified delimiter. It is easier (or at least you are less prone to mistakes) to read such files when there are no empty cells, so try to fill empty data with a missing data character, such as NA (the default):
str(read.table("sample_annotation.txt", header = TRUE, sep = "\t"))## 'data.frame': 6 obs. of 4 variables:
## $ SampleName: Factor w/ 6 levels "sample1","sample2",..: 1 2 3 4 5 6
## $ Treatment : Factor w/ 2 levels "Control","Drug": 1 1 1 2 2 2
## $ Replicate : int 1 2 3 1 2 3
## $ CellType : Factor w/ 1 level "HeLa": 1 1 1 1 1 1There are lots of additional arguments to the read.table() function; header is a boolean value that says whether or not the first row should be used to name the columns of the data frame, sep gives the delimiter between column entries (e.g. \t for tab-delimited files, or , for comma-separated files), skip tells R to skip the first n rows of the input, and nrow tells R to only load the first n rows that it sees:
str(read.table("sample_annotation.txt", header = TRUE, sep = "\t", nrow = 2))## 'data.frame': 2 obs. of 4 variables:
## $ SampleName: Factor w/ 2 levels "sample1","sample2": 1 2
## $ Treatment : Factor w/ 1 level "Control": 1 1
## $ Replicate : int 1 2
## $ CellType : Factor w/ 1 level "HeLa": 1 1str(read.table("sample_annotation.txt", header = FALSE, sep = "\t"))## 'data.frame': 7 obs. of 4 variables:
## $ V1: Factor w/ 7 levels "sample1","sample2",..: 7 1 2 3 4 5 6
## $ V2: Factor w/ 3 levels "Control","Drug",..: 3 1 1 1 2 2 2
## $ V3: Factor w/ 4 levels "1","2","3","Replicate": 4 1 2 3 1 2 3
## $ V4: Factor w/ 2 levels "CellType","HeLa": 1 2 2 2 2 2 2Notice that when the header is not used, the numeric column Replicate is now interpreted in the same way as the character columns, because now the first entry is non-numeric. By default, read.table() converts character columns into factors, which can be avoided by setting the stringsAsFactors argument to FALSE:
str(read.table("sample_annotation.txt", header = TRUE, sep = "\t", stringsAsFactors = FALSE))## 'data.frame': 6 obs. of 4 variables:
## $ SampleName: chr "sample1" "sample2" "sample3" "sample4" ...
## $ Treatment : chr "Control" "Control" "Control" "Drug" ...
## $ Replicate : int 1 2 3 1 2 3
## $ CellType : chr "HeLa" "HeLa" "HeLa" "HeLa" ...7 Control Sequences
One of the most useful things to be able to do with computers is to repeat the same command multiple times without having to do it by hand each time. For this, control sequences can be used to give you close control over the progress of your program.
7.1 IF ELSE
The first control sequence to look at is the “if else” command, which acts as a switch to run one of a selection of possible commands given a switch that you specify. For instance, you may want to do something different depending on whether a value is odd or even:
my_val <- 3
if (my_val%%2 == 0) { # If it is even (exactly divisible by 2)
  cat ("Value is even\n")
} else {              # Otherwise it must be odd
  cat ("Value is odd\n")
}
## Value is oddHere, the expression in the parentheses following “if” is evaluated, and if it evaluates to TRUE then the block of code contained within the following curly braces is evaluated. Otherwise, the block of code following the “else” statement is evaluated. You can add additional tests by using the “else if” statement:
my_val <- 27
if (my_val%%2 == 0) {
  cat("Value is divisible by 2\n")
} else if (my_val%%3 == 0) {
  cat("Value is divisible by 3\n")
} else if (my_val%%4 == 0) {
  ...
} else if (my_val%%n == 0) {
  cat("Value is divisible by n\n")
} else {
  cat("Value is not divisible by 1:n\n")
}
Each switch is followed by a block of code surrounded by curly braces, and the conditional statements are evaluated until one evaluates to TRUE, at which point R avaluates this code bloack then exits. If none of them evaluate to TRUE, then the default code block following “else” is evaluated instead. If no “else” block is present, then the default is to just do nothing. These blocks can be as complicated as you like, and you can have “if else” statements within the blocks to create a hierarchical structure. Note that this ifelse block will ony return the smallest factor of myval.
7.2 FOR
Another control structure is the “for loop”, which will conduct the code in the block multiple times for a variety of values that you specify at the start. For instance, here is a simple countdown script:
for (i in 10:1) {
  cat(i, "...\n", sep = "")
  if (i == 1) {
    cat("Blastoff!\n")
  }
}
## 10...
## 9...
## 8...
## 7...
## 6...
## 5...
## 4...
## 3...
## 2...
## 1...
## Blastoff!So the index i is taken from the set of numbers (10, 9, …, 1), starting at the first value 10, and each time prints out the number followed by a newline. Then an if statement checks to see if we have reached the final number, at which point it is time for blast off! At this point, it returns to the start of the block, updates the number to the second value 9, and repeats. It does this until there are no more values to use.
As a small aside, this is slightly inefficient. Evaluation of the if statement is conducted every single time the loop is traversed (10 times in this example). It will only ever be true at the end of the loop, so we could always take this out of the loop and evaluate the final printout after the loop is finished and save ourselves 10 calculations. Whilst the difference here is negligible, thinking of things like this may save you time in the future:
for (i in 10:1) {
  cat(i, "...\n", sep = "")
}
cat("Blastoff!\n")
## 10...
## 9...
## 8...
## 7...
## 6...
## 5...
## 4...
## 3...
## 2...
## 1...
## Blastoff!7.3 WHILE
The final main control structure is the “while loop”. This is similar to the “for loop”, and will continue to evaluate the code chunk as long as the specified expression evaluates to TRUE:
i <- 10
while (i > 0) {
  cat(i, "...\n", sep = "")
  i <- i - 1
}
cat("Blastoff!\n")
## 10...
## 9...
## 8...
## 7...
## 6...
## 5...
## 4...
## 3...
## 2...
## 1...
## Blastoff!This does exactly the same as the “for loop” above. In general, either can be used for a given purpose, but there are times when one would be more “elegant” than the other. For instance, here the for loop is better as you do not need to manually subtract 1 from the index each time.
However, if you did not know how many iterations were required before finding what you are looking for (for instance searching through a number of files), a “while loop” may be more suitable.
HOWEVER: Be aware that it is possible to get caught up in an “infinite loop”. This happens if the conditional statement never evaluates to FALSE. If this happens, press either ESCAPE or press the CONROL key and the letter c (CTRL+c) to quit out of the current function (CMD+c) for Mac). For instance, if we forget to decrement the index, i will always be 10 and will therefore never be less than 0. This loop will therefore run forever:
i <- 10
while (i > 0) {
  cat(i, "...\n", sep = "")
}
cat("Blastoff!\n")
7.4 Loop Control
You can leave control loops early by using flow control constructs. next skips out of the current loop and moves onto the next in the sequence:
for (i in 1:10) {
  if (i == 5) {
    next
  }
  cat (i, "\n", sep = "")
}
cat("Finished loop\n")
## 1
## 2
## 3
## 4
## 6
## 7
## 8
## 9
## 10
## Finished loopbreak will leave the loop entirely, and will return to the function after the last curly brace in the code chunk:
for (i in 1:10) {
  if (i == 5) {
    break
  }
  cat (i, "\n", sep = "")
}
cat("Finished loop\n")
## 1
## 2
## 3
## 4
## Finished loop8 Writing Functions in R
There are many functions available in R, and chances are if you want to do something somebody has already written the function to do it. It is best to not re-invent the wheel if possible (or at least it is more efficient – sometimes it is good to reinvent the wheel to understand how it works), but very often you will want to create your own functions to save replicating code.
A function takes in one or more variables, does something with them, and returns something (e.g. a value or a plot). For instance, calculating the mean of a number of values is simply a case of adding them together and dividing by the number of values. Let’s write a function to do this and check that it matches the mean() function in R:
my_mean <- function (x) { # Here, x is a numeric vector
  nvals <- length(x)
  valsum <- sum(x)
  return (valsum/nvals)
}
my_vals <- c(3,5,6,3,4,3,4,7)
my_mean(my_vals)
## [1] 4.375mean(my_vals)## [1] 4.375So, as with the loops earlier, the function is contained within a block of curly braces. A numeric vector is given to the function, the mean is calculated, and this value is returned to the user using the return() function. This value can be captured into a variable of your choosing in the same way as with any function.
You can also add further arguments to the function call. If you want an argument to have a default value, you can specify this in the function declaration. This is the value that will be used if no argument value is specified. Any arguments that do not have a default value must be specified when calling the function, or an error will be thrown:
foo <- function(x, arg) {
  return(paste(x, arg, sep = " "))
}
foo ("Hello")
## Error in paste(x, arg, sep = " "): argument "arg" is missing, with no defaultNow let’s try and add a default value for arg:
foo <- function(x, arg = "World!") {
  return(paste(x, arg, sep = " "))
}
foo ("Hello")
## [1] "Hello World!"This is a good point to mention an idea known as “scope”. After running the following function, have a look at the value valsum calculated within the function:
my_mean <- function (x) { # Here, x is a numeric vector
  nvals <- length(x)
  valsum <- sum(x)
  return (valsum/nvals)
}
my_vals <- c(3,5,6,3,4,3,4,7)
my_mean(my_vals)
## [1] 4.375print(valsum) ## Error in print(valsum): object 'valsum' not foundSo what went wrong? The error message says that R cannot find the object valsum. So where is it? The “scope” of an object is the environment where it can be found. Up until now, we have been using what are known as “global variables”. That is we have created all of our objects within the “global environment”, which is the top level where R searches for objects. These objects are available at all times.
However, when we call a function, a new environment, or “scope”, is created, and all variables created within the function become “local variables” that can only be accessed from within the function itself. As soon as we leave the function, these local variables are deleted. If you think about it, this makes sense – otherwise, every time we called a function, memory would fill up with a whole load of temporary objects. Also, how many functions do you think create an object called x? Pretty much all of them (it’s generally the name of the first argument, as in my example). If we created an object x, then ran a couple of functions, and then went to use x again, chances are it would no longer be what we thought it was.
So, the function itself is completely self-contained. A copy of the input variable is stored in a new local variable called x, something is done to this object (possibly creating additional objects along the way), something is returned, and then all of these objects in the scope of the function are removed, and we move back into the global environment.
Functions are incredibly useful when we want to repeat the same set of actions on multiple sets of data. The “apply”" set of functions are very useful for running a single function multiple times on input data.
apply() works on a matrix or data frame, and applies the function named by the argument FUN across either the rows or the columns of the table, as specified with the MAR (margin) argument (MAR=1 for rows, MAR=2 for columns). For instance, suppose that you had a matrix of expression values from a microarray, where each row was a different gene, and each column is the signal from a different probe on the array. We may want to calculate the mean value across these probes for each gene:
probe_file  <- "probe_values.txt"
probe_dat   <- read.table(probe_file, header = TRUE, sep = "\t")
probe_means <- apply(probe_dat[, -1], MAR = 1, FUN = mean)
probe_means
## [1] 21.2 29.8 85.8 63.6 25.6 44.8 70.8 88.4 47.6 35.8 90.2 57.8 24.2 23.2
## [15] 25.0 57.6 83.0 62.8 33.8 28.4 13.2 58.4 24.6 28.2 47.2 6.4 94.6 14.2
## [29] 39.6 53.4 80.2 47.8 9.8 58.8 59.8 0.4 63.8 33.0 22.4 53.8 37.8 68.8
## [43] 99.6 97.6 5.0 59.8 95.4 -0.2 1.4 52.2Additionally, apply can be used to apply a function to all values by using MAR=c(1,2) to run across rows and columns:
probe_file    <- "probe_values.txt"
probe_dat     <- read.table(probe_file, header = TRUE, sep = "\t")
probe_dat_log <- apply(probe_dat[, -1], MAR = c(1,2), FUN = exp)
probe_dat_log
## Probe1 Probe2 Probe3 Probe4 Probe5
## [1,] 4.424134e+05 7.896296e+13 2.648912e+10 2.980958e+03 3.931334e+12
## [2,] 3.931334e+12 1.907347e+21 8.886111e+06 5.987414e+04 1.285160e+19
## [3,] 2.235247e+37 5.052394e+31 1.811239e+41 1.220403e+39 8.223013e+36
## [4,] 3.404276e+29 4.607187e+28 5.685720e+24 1.373383e+32 1.041376e+23
## [5,] 3.584913e+09 1.068647e+13 1.484132e+02 7.896296e+13 8.659340e+16
## [6,] 3.493427e+19 2.581313e+20 1.142007e+26 3.185593e+16 5.834617e+14
## [7,] 2.758513e+33 1.545539e+25 6.837671e+30 1.373383e+32 1.373383e+32
## [8,] 2.451246e+40 1.373383e+32 4.375039e+48 3.025077e+36 2.038281e+34
## [9,] 3.185593e+16 1.907347e+21 1.041376e+23 1.545539e+25 2.353853e+17
## [10,] 2.146436e+14 6.565997e+07 1.285160e+19 2.581313e+20 1.171914e+16
## [11,] 2.235247e+37 6.076030e+37 5.399228e+44 6.837671e+30 1.467662e+45
## [12,] 1.142007e+26 8.438357e+26 4.201210e+25 7.016736e+20 1.142007e+26
## [13,] 1.784823e+08 1.784823e+08 4.311232e+15 5.987414e+04 4.311232e+15
## [14,] 9.744803e+09 1.627548e+05 9.744803e+09 2.353853e+17 6.565997e+07
## [15,] 1.957296e+11 7.200490e+10 4.851652e+08 2.146436e+14 1.318816e+09
## [16,] 2.091659e+24 3.493427e+19 1.858672e+31 1.014800e+33 8.659340e+16
## [17,] 2.038281e+34 2.451246e+40 4.923458e+41 5.540622e+34 1.252363e+29
## [18,] 9.253782e+29 3.831008e+22 4.093997e+35 1.545539e+25 1.041376e+23
## [19,] 4.311232e+15 1.907347e+21 1.957296e+11 2.146436e+14 7.200490e+10
## [20,] 1.446257e+12 1.318816e+09 5.834617e+14 5.320482e+11 7.896296e+13
## [21,] 8.103084e+03 2.648912e+10 3.584913e+09 5.459815e+01 1.096633e+03
## [22,] 6.235149e+27 5.685720e+24 7.694785e+23 2.515439e+30 9.496119e+19
## [23,] 3.584913e+09 6.398435e+17 2.415495e+07 1.318816e+09 3.584913e+09
## [24,] 3.584913e+09 5.987414e+04 4.311232e+15 8.659340e+16 2.146436e+14
## [25,] 1.409349e+22 8.659340e+16 1.285160e+19 4.201210e+25 4.727839e+18
## [26,] 1.096633e+03 7.389056e+00 1.957296e+11 1.096633e+03 4.539993e-05
## [27,] 1.811239e+41 1.112864e+36 4.093997e+35 7.307060e+43 4.375039e+48
## [28,] 1.627548e+05 3.931334e+12 1.353353e-01 1.627548e+05 4.851652e+08
## [29,] 1.739275e+18 1.285160e+19 1.907347e+21 8.659340e+16 2.648912e+10
## [30,] 7.016736e+20 4.201210e+25 2.091659e+24 1.739275e+18 8.438357e+26
## [31,] 4.093997e+35 1.858672e+31 6.663176e+40 4.093997e+35 6.837671e+30
## [32,] 1.409349e+22 2.830753e+23 3.831008e+22 8.659340e+16 4.727839e+18
## [33,] 2.415495e+07 1.484132e+02 2.648912e+10 1.000000e+00 2.008554e+01
## [34,] 6.837671e+30 1.409349e+22 1.041376e+23 1.694889e+28 2.830753e+23
## [35,] 1.252363e+29 1.041376e+23 6.837671e+30 3.104298e+26 2.581313e+20
## [36,] 5.459815e+01 3.059023e-07 4.424134e+05 8.315287e-07 1.202604e+06
## [37,] 9.253782e+29 1.142007e+26 4.093997e+35 1.041376e+23 7.694785e+23
## [38,] 1.068647e+13 3.185593e+16 5.320482e+11 1.586013e+15 1.586013e+15
## [39,] 2.415495e+07 9.744803e+09 1.586013e+15 3.931334e+12 2.980958e+03
## [40,] 7.694785e+23 6.398435e+17 5.685720e+24 1.041376e+23 2.293783e+27
## [41,] 5.834617e+14 1.068647e+13 4.727839e+18 1.446257e+12 2.830753e+23
## [42,] 9.253782e+29 1.858672e+31 5.540622e+34 7.694785e+23 3.404276e+29
## [43,] 1.338335e+42 6.493134e+50 1.084464e+46 1.220403e+39 1.651636e+38
## [44,] 1.811239e+41 4.093997e+35 3.989520e+45 1.986265e+44 1.467662e+45
## [45,] 5.459815e+01 5.459815e+01 6.565997e+07 6.144212e-06 5.987414e+04
## [46,] 4.607187e+28 4.201210e+25 7.694785e+23 3.831008e+22 1.252363e+29
## [47,] 4.489613e+38 2.178204e+47 2.758513e+33 3.989520e+45 1.338335e+42
## [48,] 7.389056e+00 3.678794e-01 1.831564e-02 1.125352e-07 6.565997e+07
## [49,] 5.459815e+01 1.234098e-04 6.565997e+07 9.118820e-04 2.718282e+00
## [50,] 9.496119e+19 7.694785e+23 1.142007e+26 6.398435e+17 4.201210e+25The same results can be generated by using a for loop to loop over all entries, but this is much slower.
lapply() (“list apply”) is similar but runs over a list of values, and returns the output as a list of values. In this example, the mean is calculated for a number of vectors, but these vectors can be different sizes (unlike for a matrix or data frame):
my_list <- list(val1 = c(2,4,2,3,4,3,4),
                val2 = c(1,2),
                val3 = c(10,2,5,9))
lapply(my_list, FUN = mean)
## $val1
## [1] 3.142857
##
## $val2
## [1] 1.5
##
## $val3
## [1] 6.5However, since the output is a list, the output could also be a list of vectors:
my_list <- list(val1 = c(2,4,2,3,4,3,4),
                val2 = c(1,2),
                val3 = c(10,2,5,9))
lapply(my_list, FUN = sort)
## $val1
## [1] 2 2 3 3 4 4 4
##
## $val2
## [1] 1 2
##
## $val3
## [1] 2 5 9 10sapply() (“simple apply”) is similar to lapply(), but returns the results as a vector rather than a list. This is a better method to use when returning a single value for each list entry:
my_list <- list(val1 = c(2,4,2,3,4,3,4),
                val2 = c(1,2),
                val3 = c(10,2,5,9))
sapply(my_list, FUN = mean)
## val1 val2 val3
## 3.142857 1.500000 6.500000mapply() (“multivariate apply”) is very useful for vectorization, and works by applying the function FUN to the first elements of each object, then to the second element, and so on. The following example will replicate the number n n-times for numbers 1 to 5. This could also be done using loops, but loops do not scale as well as vectorised functions such as this:
mapply(rep, 1:5, 1:5)## [[1]]
## [1] 1
##
## [[2]]
## [1] 2 2
##
## [[3]]
## [1] 3 3 3
##
## [[4]]
## [1] 4 4 4 4
##
## [[5]]
## [1] 5 5 5 5 5tapply() is a little more complicated, but essentially applies a function after breaking data up based on some index variable. It is useful for calculating summary statistics of different groups of data, and uses a factor parameter INDEX to define the groups over which to apply the function FUN. So in the following code, tapply will apply the function mean() on the values of Expression for the two different treatment classes defined in the INDEX variable:
my_dat <- data.frame(Treatment = c("Control", "Control", "Control",
                                   "Treated", "Treated", "Treated"),
                     Expression = c(13, 17, 9,
                                    28, 37, 34))
tapply(my_dat$Expression, INDEX = my_dat$Treatment, FUN = mean)
## Control Treated
## 13 339 Some Simple Statistics
R is mainly designed for easy computation of statistics and there are many in-built functions and additional libraries that allow you to carry out most tasks. Most simple statistics can be easily calculated using in-built functions. The following example creates two vectors of 100 random values sampled from a normal distribution with mean 0 and standard deviation 1, then calculates various basic summary statistics:
x <- sort(rnorm(100, mean = 0, sd = 1))
min(x)
## [1] -3.202274max(x) ## [1] 2.25075mean(x) ## [1] -0.1991225median(x)## [1] -0.1258713The minimum and maximum values are the smallest and largest values respectively. The mean is what most people would think of when you asked for the average, and is calculated by summing the values and dividing by the total number of values. The median is another way of looking at the average, and is essentially the middle value (50^th^ percentile). Other percentiles can be calculated, which can give you an idea of where the majority of your data lie:
quantile(x, probs = 0.25) ## 25%
## -0.8878962quantile(x, probs = 0.75) ## 75%
## 0.5536743quantile(x, probs = seq(0, 1, 0.1))## 0% 10% 20% 30% 40% 50%
## -3.20227420 -1.69813617 -1.03303233 -0.70886298 -0.41779966 -0.12587129
## 60% 70% 80% 90% 100%
## 0.04347479 0.43460739 0.79858176 1.18049155 2.25074971The summary() function will calculate many of these basic statistics for you:
summary(x)## Min. 1st Qu. Median Mean 3rd Qu. Max.
## -3.2023 -0.8879 -0.1259 -0.1991 0.5537 2.2508The variance is the average of the squared distances from the mean, and is a measure of how spread out the data are from the average. The standard deviation is simply the square root of this value \(var(x) = sd(x)^2\):
sd(x)## [1] 1.125745var(x)## [1] 1.267302all.equal(sd(x)^2, var(x))## [1] TRUEsum((x-mean(x))^2)/(length(x)-1)## [1] 1.267302The covariance is a measure of how much two sets of data vary together:
y <- sort(rnorm(100, mean = 0, sd = 1))
var(y)
## [1] 1.309628cov(x, y)## [1] 1.262716The covariance is related to the correlation between two data sets, which is a number between -1 and 1 indicating the level of dependance between the two variables. A value of 1 indicates perfect correlation, so that as one value increases so does the other. A value of -1 indicates perfect anti-correlation, so that as one value increases the other decreases. A value of 0 indicates that the two values change independently of one another:
cor(x, y)## [1] 0.9801482cov(x, y)/(sd(x) * sd(y)) ## [1] 0.9801482This value is known as the Pearson correlation. An alternative method for calculating the correlation between two sets of values is to use the Spearman correlation, which is essentially the same as the Pearson correlation but is calculated on the ranks of the data rather than the values themselves. In this way, each value increases by only one unit at a time, meaning that the correlation score is more robust to the presence of outliers:
cor(x, y, method = "spearman")## [1] 1So these values are pretty highly dependent on one another – not surprising considering that they are both drawn randomly from the same distribution. We can calculate the line of best fit between the two vectors by using linear regression, which searches for the best straight line model \(y = a + bx\) that minimises the squared distances between the line (estimated values) and the observed data points:
my_lin_mod <- lm(y ~ x)
summary(my_lin_mod)
##
## Call:
## lm(formula = y ~ x)
##
## Residuals:
## Min 1Q Median 3Q Max
## -0.25245 -0.12222 -0.05954 0.03826 1.08004
##
## Coefficients:
## Estimate Std. Error t value Pr(>|t|)
## (Intercept) 0.17036 0.02316 7.355 5.86e-11 ***
## x 0.99638 0.02036 48.939 < 2e-16 ***
## ---
## Signif. codes: 0 '***' 0.001 '**' 0.01 '*' 0.05 '.' 0.1 ' ' 1
##
## Residual standard error: 0.228 on 98 degrees of freedom
## Multiple R-squared: 0.9607, Adjusted R-squared: 0.9603
## F-statistic: 2395 on 1 and 98 DF, p-value: < 2.2e-16Explaining this output is beyond the scope of this short tutorial, but the coefficient estimates give us the values for a (0.1703647) and b (0.9963813) in the linear model. The p-value tells us how significant these estimates are. In statistical terms, we are testing the null hypothesis that the coefficient is actually equal to zero (i.e. there is not an association between x and y). The p-value gives the probability of detecting a coefficient at least as large as the one that we calculated in our model given that the null hypothesis is actually true. If this probability is low enough, we can safely reject the null hypothesis and say that this variable is statistically significant. Often a value of 0.05 (5%) is used as the cutoff for rejection of the null hypothesis.
Hypothesis testing is a large part of statistics. The t-test is a commonly used test for comparing the means of two sets of data. In simple terms we are looking to see if they are significantly different (e.g. does the expression of a particular gene change significantly following treatment with a drug). In statistical terms, we are testing to see if the change that we see in the means is greater than we would expect by chance alone.
t.test(x, y) ##
## Welch Two Sample t-test
##
## data: x and y
## t = -1.0658, df = 197.95, p-value = 0.2878
## alternative hypothesis: true difference in means is not equal to 0
## 95 percent confidence interval:
## -0.4876502 0.1454797
## sample estimates:
## mean of x mean of y
## -0.1991225 -0.0280373Since both x and y are drawn from the same distribution, the test shows there is no evidence that there is a difference between the mean. Let’s try again with a different data set, drawn from a different distribution:
z <- rnorm(100, mean = 10, sd = 1)
t.test(x, z)
##
## Welch Two Sample t-test
##
## data: x and z
## t = -70.169, df = 189.87, p-value < 2.2e-16
## alternative hypothesis: true difference in means is not equal to 0
## 95 percent confidence interval:
## -10.454175 -9.882483
## sample estimates:
## mean of x mean of y
## -0.1991225 9.9692063This time, the p-value is much less than 0.05, so we can make the claim that the mean of z is significantly different from that of x. By default, the t.test() function is 2-sided, meaning that it does not distinguish between whether or not the difference in the means is an increase or a decrease in z. We can specify the alternative parameter to define the alternative hypothesis that we want to test:
t.test(x, z, alternative = "less") ## Tests if mean(x) < mean(z) ##
## Welch Two Sample t-test
##
## data: x and z
## t = -70.169, df = 189.87, p-value < 2.2e-16
## alternative hypothesis: true difference in means is less than 0
## 95 percent confidence interval:
## -Inf -9.928799
## sample estimates:
## mean of x mean of y
## -0.1991225 9.9692063t.test(x, z, alternative = "greater") ## Tests if mean(x) > mean(z)##
## Welch Two Sample t-test
##
## data: x and z
## t = -70.169, df = 189.87, p-value = 1
## alternative hypothesis: true difference in means is greater than 0
## 95 percent confidence interval:
## -10.40786 Inf
## sample estimates:
## mean of x mean of y
## -0.1991225 9.9692063This tells us that the difference in the means between x and z is less than 0, or that the mean of z is greater than that of x (as we expect).
10 Plotting With R
One of the most useful functions of R is the ability to plot publication-quality figures simply and easily. The vast number of tools available to users for plotting figures is beyond the scope of this tutorial, but I will mention a few of the most commonly used plotting functions to allow you to have a quick look at your data. These functions are all part of the base plotting package, but I also recommend looking into the ggplot2() package for an incredibly intuative appraoch to plotting data.
10.1 Scatterplots
Scatterplots are probably the simplest plot that we can look at. Here we take two sets of values and plot one against the other to see how they correlate. This means that the two data sets are paired, such that the first element of each data set represents one event, the second represents another, and so on. For instance, for every student in a class, we may have scores from tests taken at the start and at the end of the year, and we want to compare them against one another to see how they compare. Here is how to plot a simple scatterplot:
plot(x, y,
     pch = 19,                  ## Plot each point as a filled circle
     col = "red",               ## Colour each point red
     xlab = "This is x",        ## Add a label to the x-axis
     ylab = "This is y",        ## Add a label to the y-axis
     main = "This is y vs. x",  ## Add a main title to the plot
     cex.main = 1.4,            ## Change the size of the title
     cex.lab  = 1.2,            ## Change the size of the axis labels
     cex.axis = 1.1             ## Change the size of the axis values
     )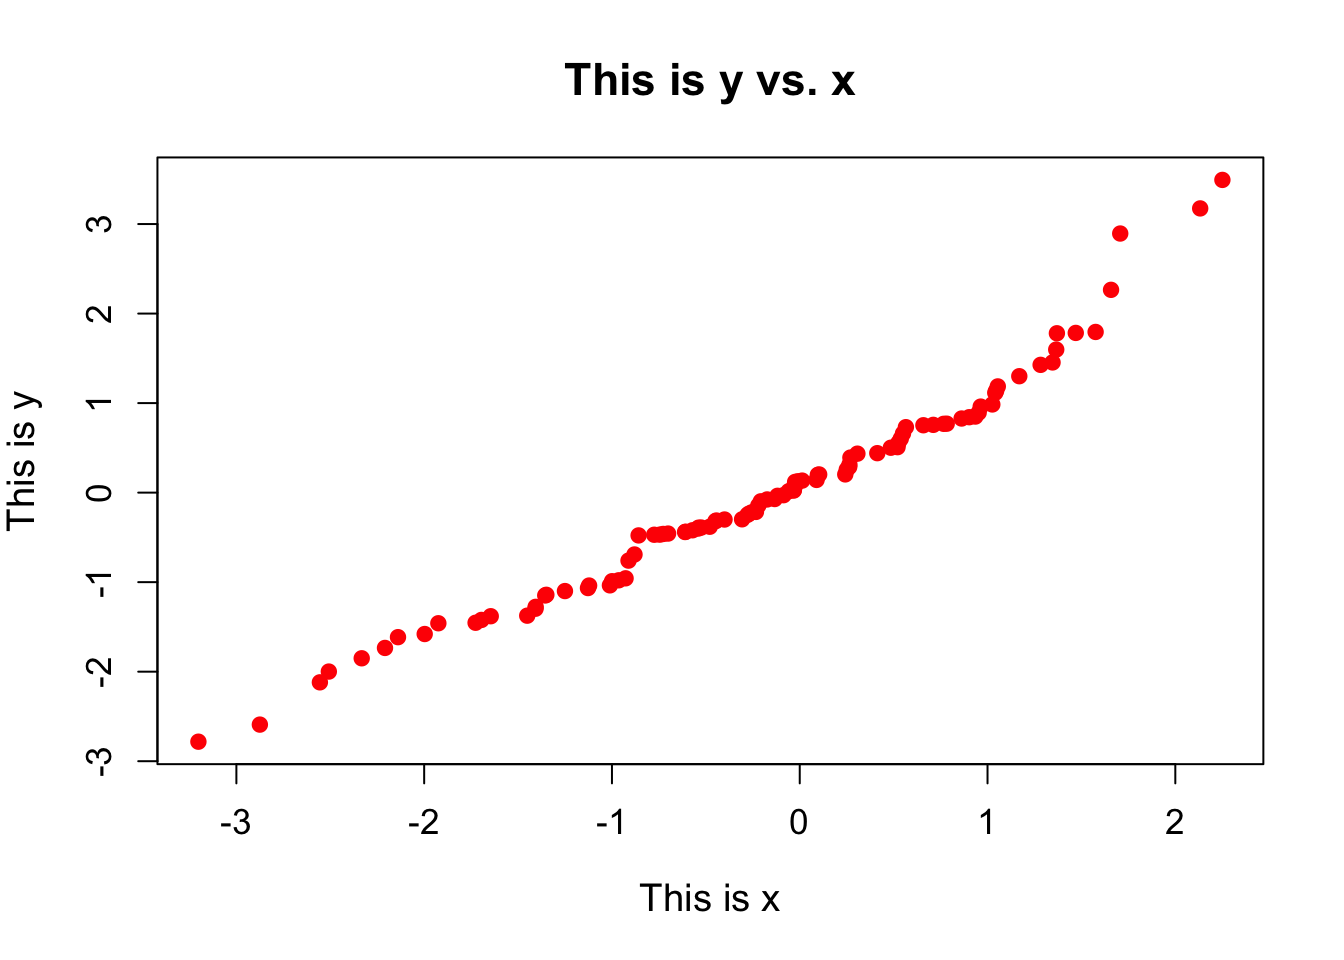
There are lots of additional plotting arguments that can be set in the plot() command. These are just a few. These arguments will typically work for any plotting function that you may want to use.
plot() is the standard plotting function, and works differently depending on the type of data on which it is called. Most of the following plots use this function in some way, even though it may not be obvious.
Here we have coloured all of our points a single colour by using the col = "red" argument. However, we can assign colours to each point separately by supplying a vector of colours that is the same length as x and y. This means that we can set colours based on the data themselves:
my_cols <- rep("black", length(x))
my_cols[x > 1 & y >  1] <- "red"
my_cols[x > 1 & y < -1] <- "green"
my_cols[x < 0 & y >  0] <- "blue"
plot(x, y, col = my_cols, pch = 19)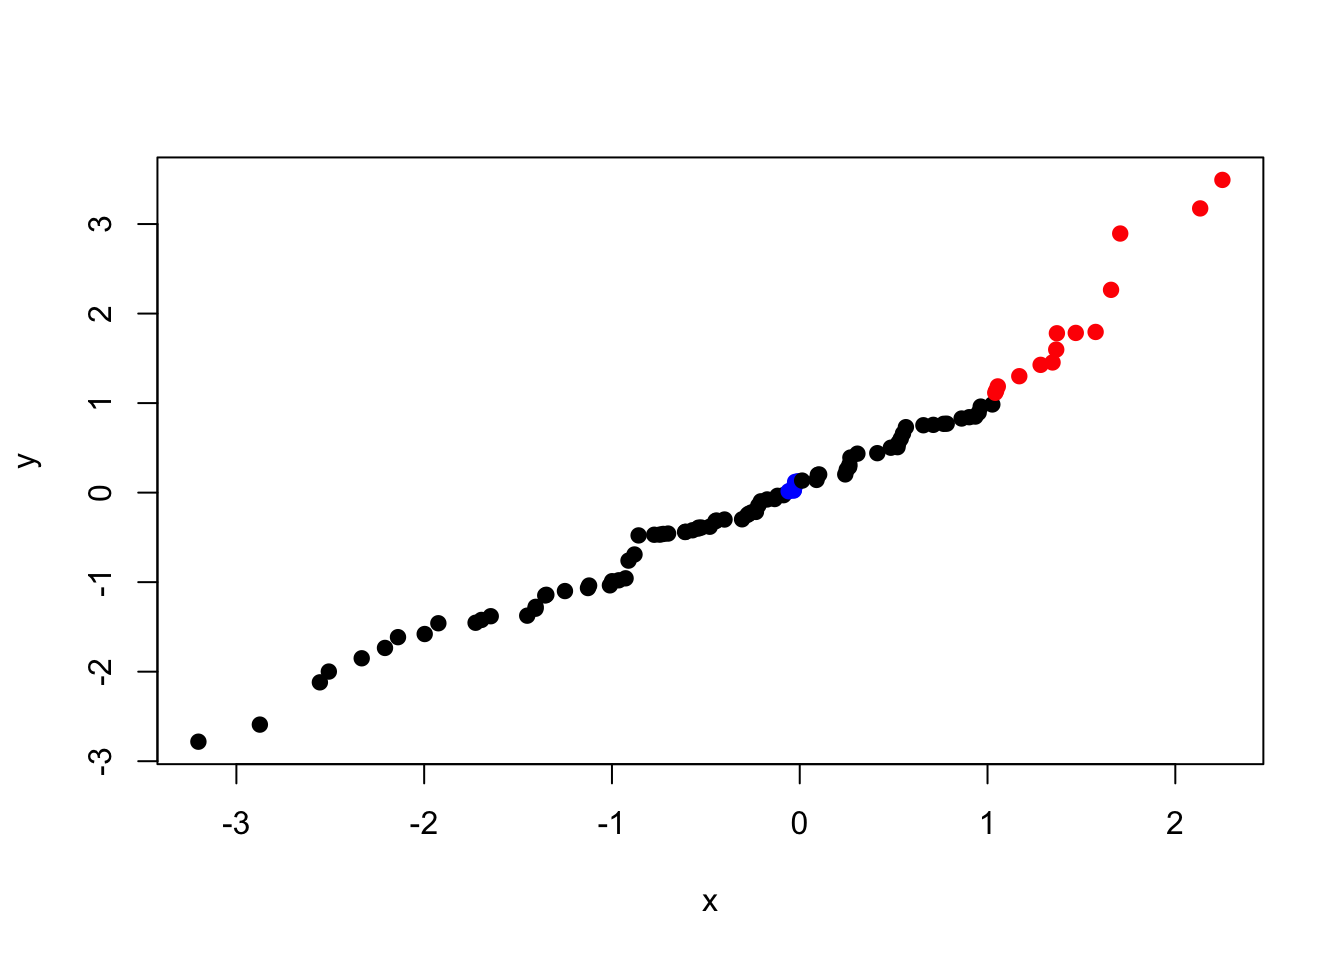
Since this plot is useful for observing the level of correlation between two data sets, it may be useful to add a couple of lines in to the plot to help us determine if there is a trend indicating that x is well correlated with y. First of all we will add lines in through the origin, and then we will add in a dotted line along the x = y line (since, if the two datasets were exactly correlated, the points would lie on this line). To do this, we use the abline() function. This plots a straight line in one of three ways. We can either specify a horizontal line by specifying the h argument, or we can specify a vertical line by using the v argument, or we can specify a straight line in the format \(y = a + bx\) (where a is the intercept term and b is the gradient term):
plot(x, y, ylim = c(-3,3), xlim = c(-3,3))
abline(h = 0)
abline(v = 0)
abline(a = 0, b = 1, lty = 2) ## lty gives the line type - in this case dotted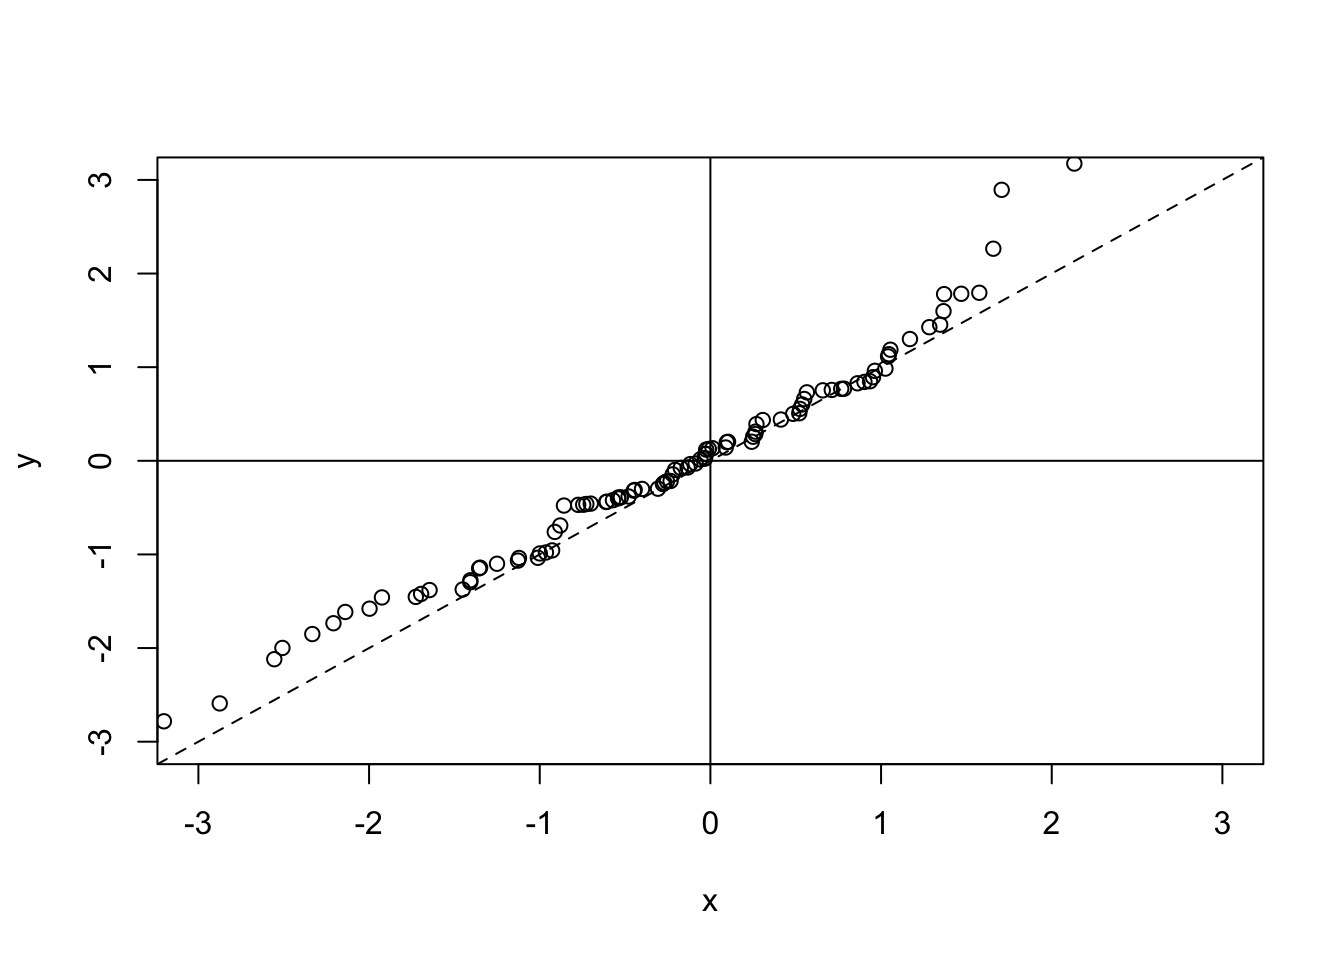
Notice that abline() does not create a new plot, but instead adds to the plot that we already have. This is because it does not call the plot.new() function, which would otherwise create a new plotting region.
We may be particularly interested in how the line of best fit looks as compared to the \(x = y\) line, as this will show us if there is a general trend in the data or not. To do this we can use a linear model to predict a and b from the data:
plot(x, y, ylim = c(-3,3), xlim = c(-3,3))
my_lin_model <- lm(y ~ x)
abline(my_lin_model, lty = 2, col = "red")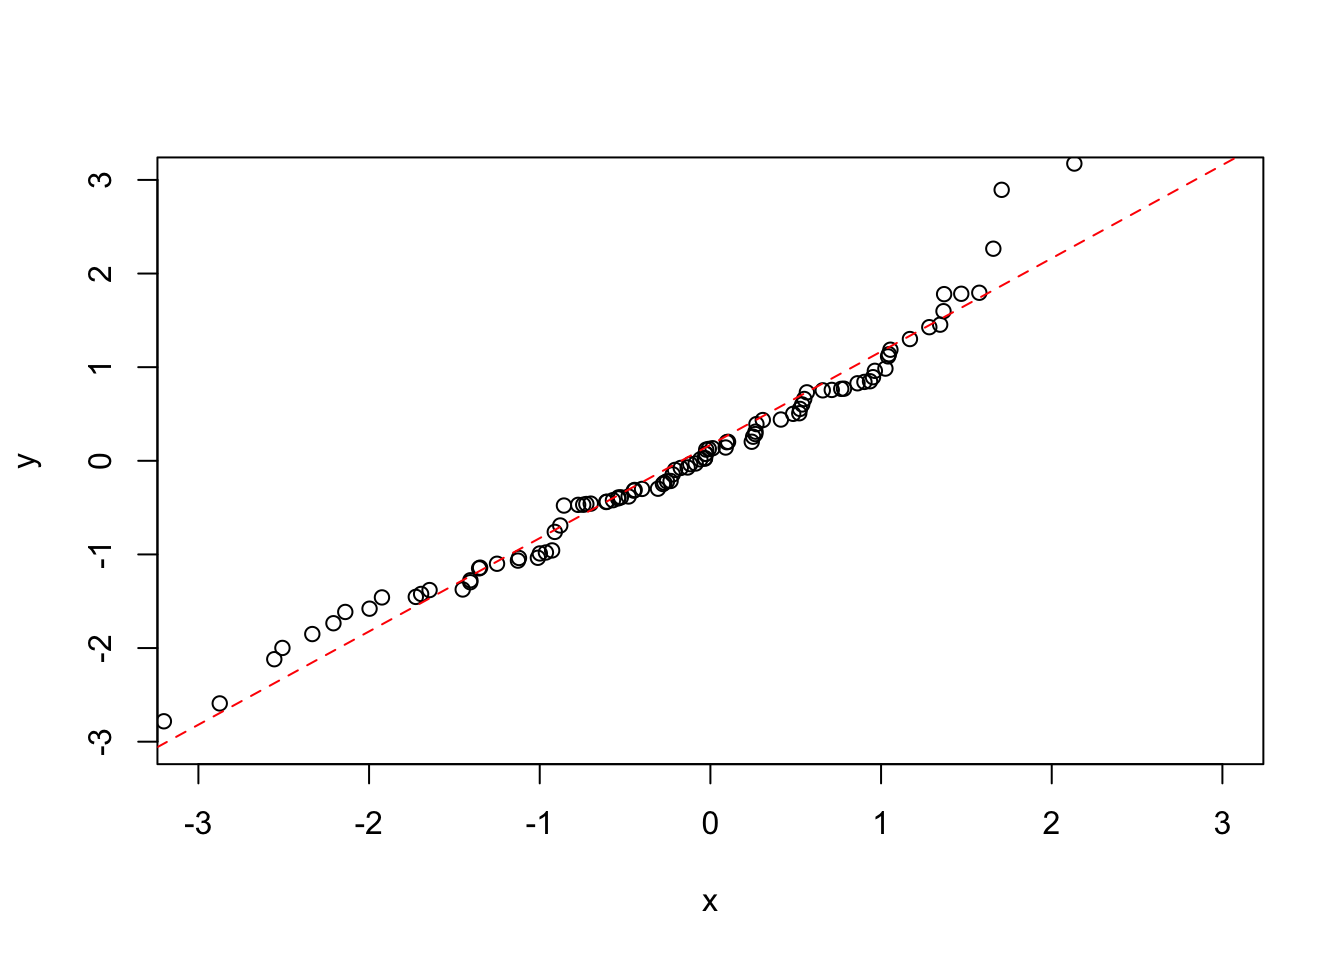
If you want to explicitly pull out a and b, use the coef() function to get the coefficients:
coef(my_lin_model)[1] ## Get the intercept from the coefficients of the model ## (Intercept)
## 0.1703647coef(my_lin_model)[2] ## Get the gradient from the coefficients of the model## x
## 0.996381310.2 Histograms
Now let’s look at the distribution of the data. A histogram is useful for this. Here we count up the number of values that fall into discrete bins. The size of the bins (or the number of bins) can be specified by using the breaks argument:
x <- rnorm (1000)
par(mfrow=c(1,2))
hist(x) ## Shows a nice bell shape curve about mean 0
hist(x, breaks = 200) ## More fine-grained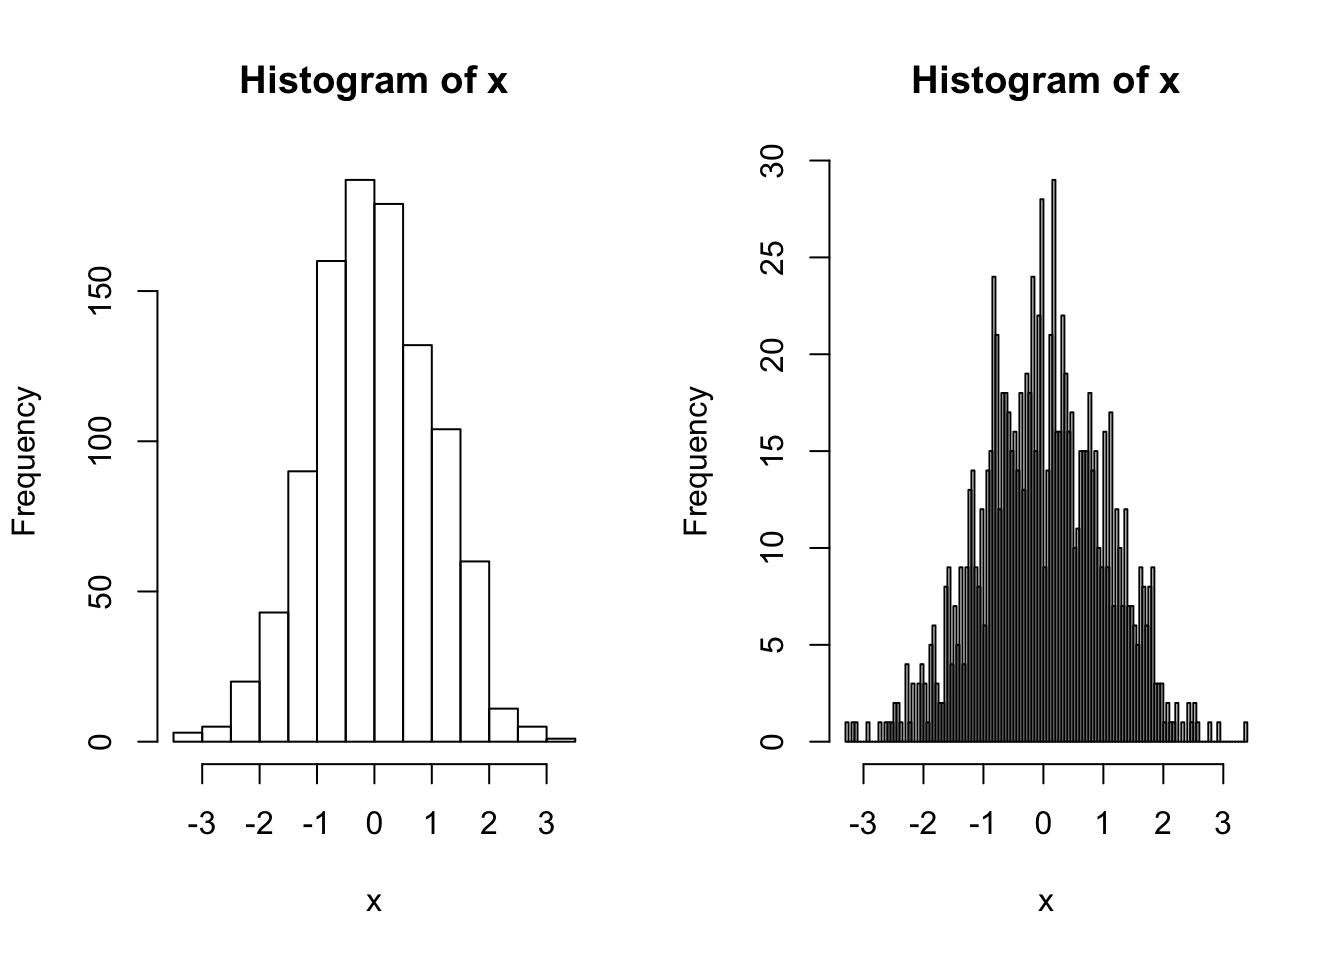
10.3 Quantile-Quantile Plots
Quantile-quantile plots are a particular type of scatterplot that are used to see if two data sets are drawn from the same distribution. To do this, it plots the quantiles of each data set against each other. That is it plots the 0th percentile of data set A (the minimum value) against the 0th percentile of data set B, the 50th percentiles (the medians) against each other, the 100th percentiles (the maximum values) against each other, etc. Simply, it sorts both data sets, and makes them both the same length by estimating any missing values, then plots a scatterplot of the sorted data. If the two data sets are drawn from the same distribution, this plot should follow the \(x = y\) identity line at all but the most extreme point.
Here is a QQ plot for two data sets drawn from the same normal distribution:
x1 <- rnorm(100, mean = 0, sd = 1)
x2 <- rnorm(1000, mean = 0, sd = 1)
qqplot(x1, x2)
abline(a = 0, b = 1, lty = 2)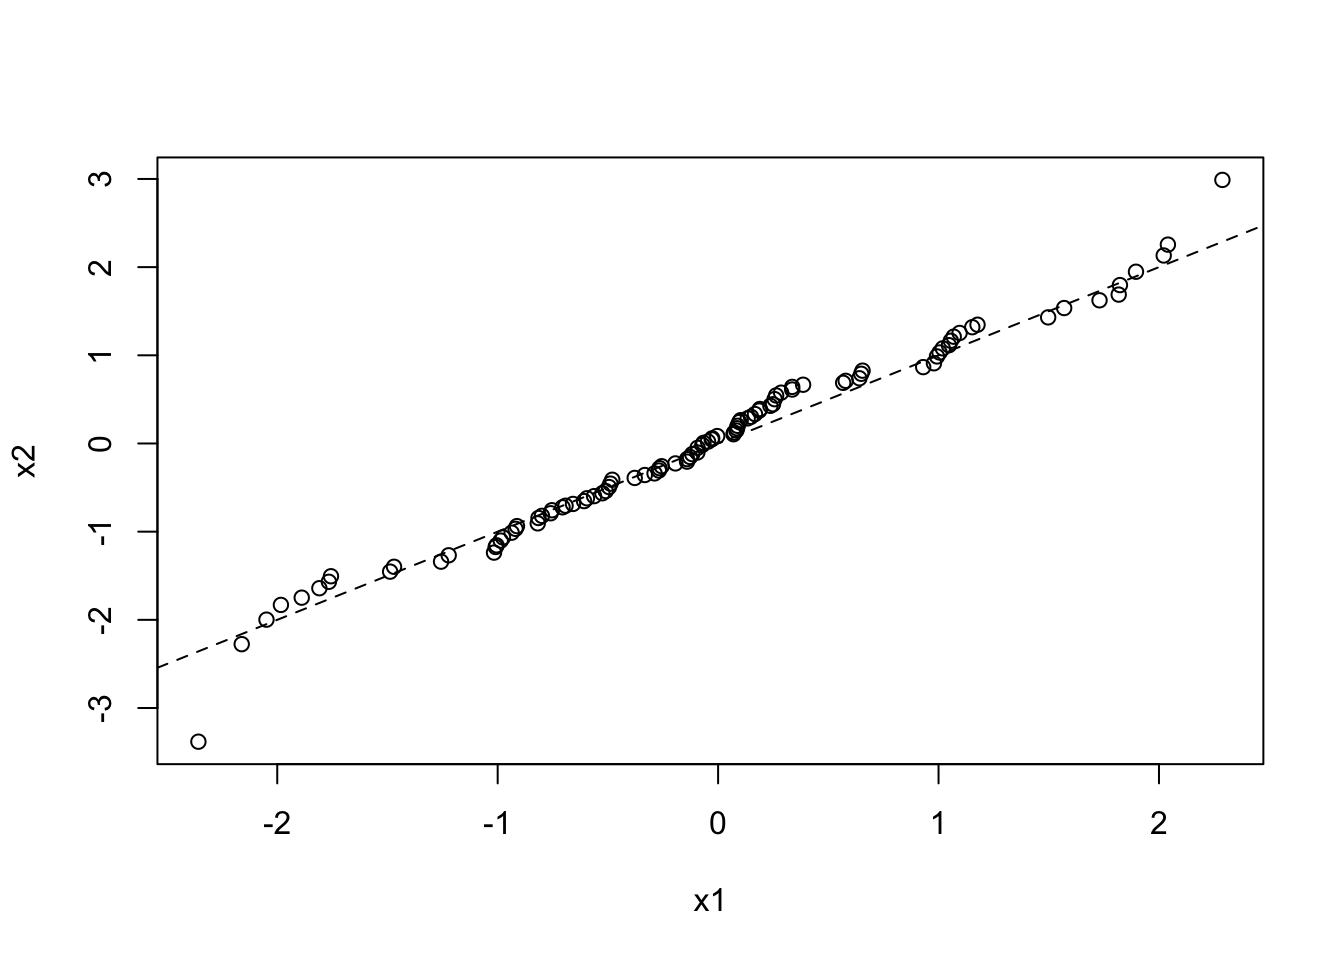
And here is a QQ plot for two data sets drawn from different normal distributions:
x1 <- rnorm(100, mean = 0, sd = 1)
x2 <- rnorm(1000, mean = 1, sd = 3)
qqplot(x1, x2)
abline(a = 0, b = 1, lty = 2)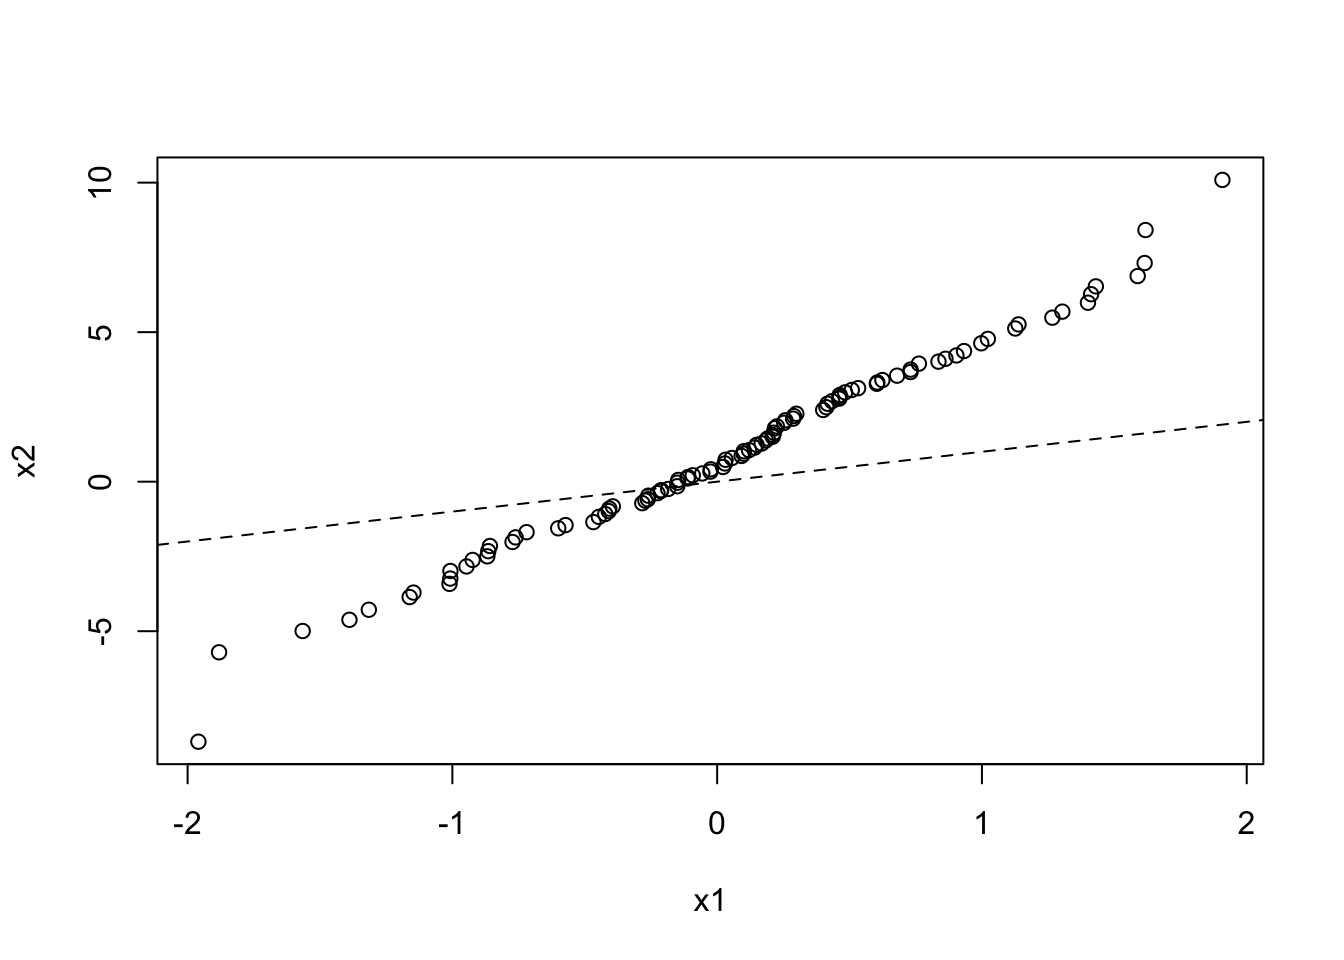
10.4 Line Plots
Scatterplots are useful for generating correlation plots for pairs of data. Another form of data is a set of values along a continuum, for instance we may have the read count along the length of the genome. For this, a scatterplot may not be the most sensible way of viewing these data. Instead, a line plot may be a more fitting way of viewing the data. To do this we simply specify the type argument to be line (or simply l).
One thing to be careful of with data such as this is that you must make sure that the data are ordered from left to right (or right to left) on the x axis so that connecting the points makes sense on the continuum. For instance, the following plot is not terribly useful:
x = c(2,4,5,3,1,7,9,8,6,10)
y = c(4,2,5,4,10,6,6,5,6,9)
plot(x = x, y = y, type = 'l')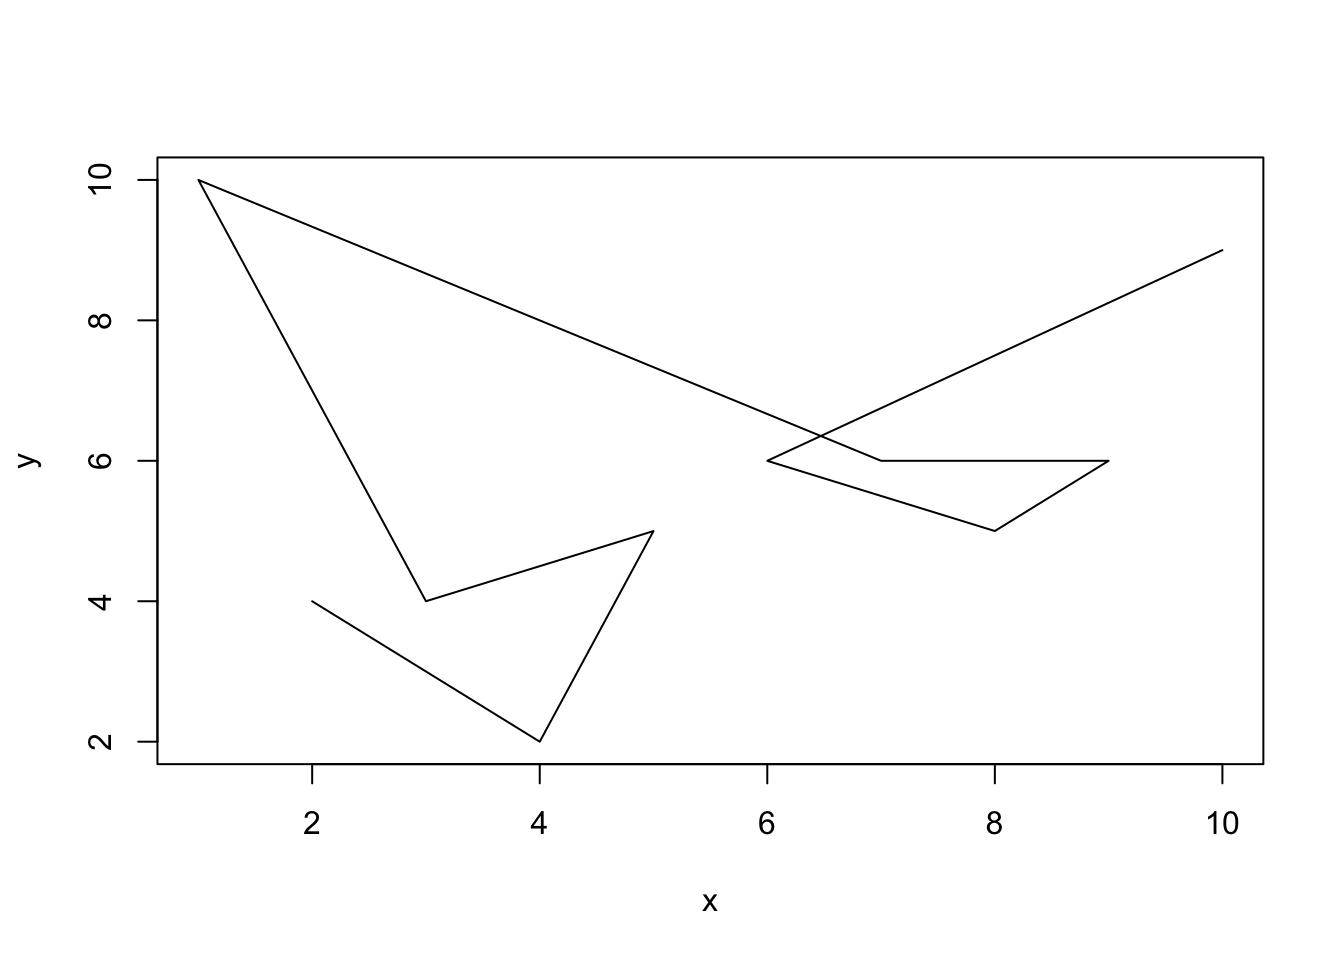 But if we order the data from left to right then it will be a lot more useful:
plot(x = x[order(x)], y = y[order(x)], type = 'l')  You can also plot both points and lines by setting the
 type argument to both (or b):
plot(x = x[order(x)], y = y[order(x)], type = 'b')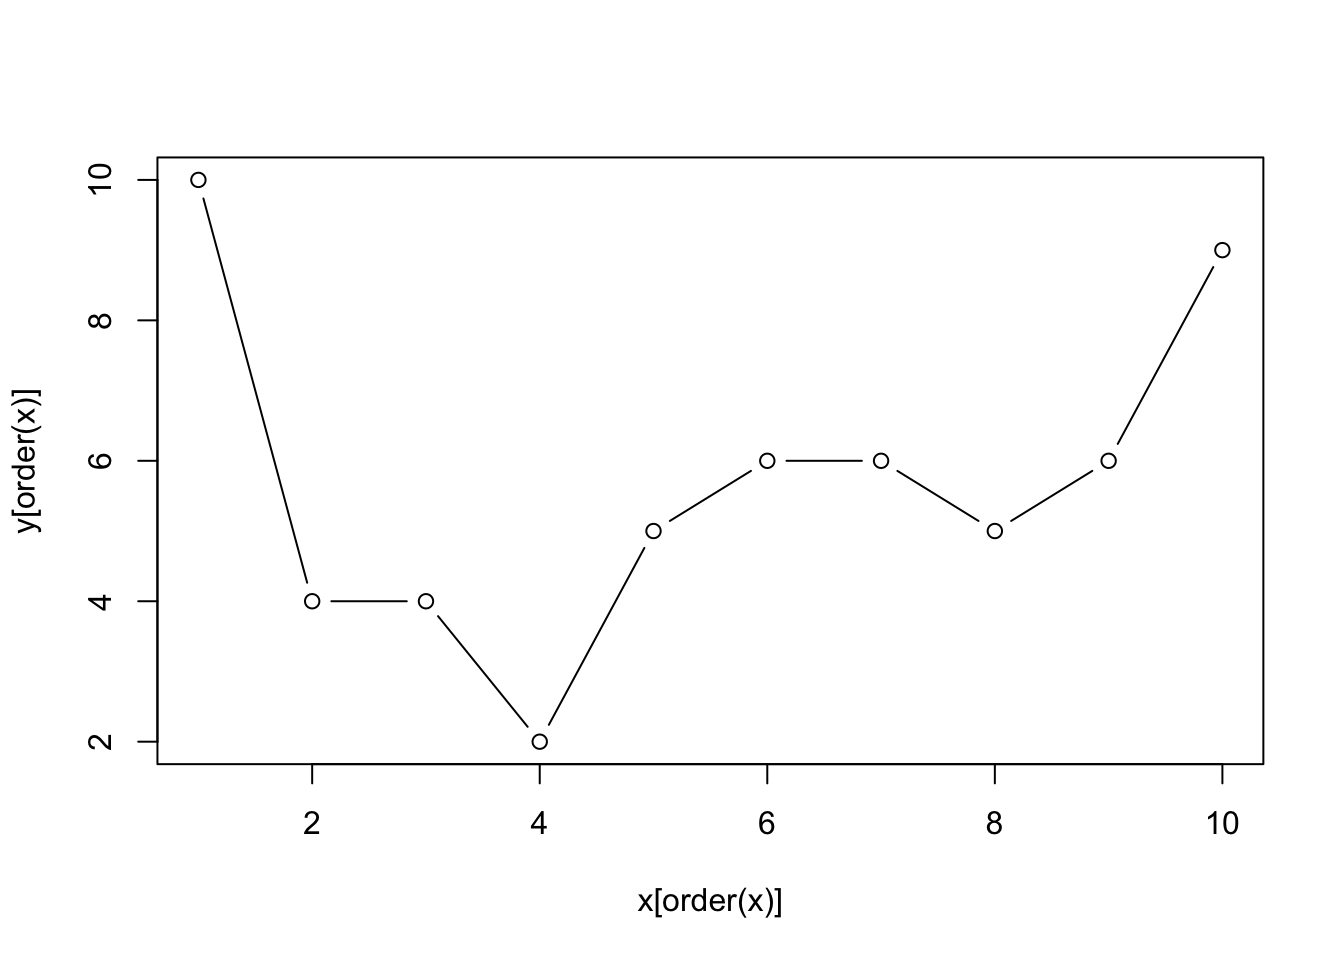
10.5 Density Plots
We can use a line plot like this to plot the density of the data, which gives us a similar plot to the histogram. The benefit of this type of plot over a histogram is that you can overlay the distribution of multiple data sets. The density() function is a kernal density estimator function that basically calculates the density of the data within each bin such that the total area under the resulting curve is 1. This makes these plots useful for comparing data sets of different sizes as they are essentially normalised. We can add a legend to this plot to make it clear which line represents which sample. Again, this does not call plot.new() so will appear on top of the current plot:
## Create 2 random normal distributions about 5 and 10 respectively
x1 <- rnorm(100, mean = 5, sd = 1)
x2 <- rnorm(1000, mean = 10, sd = 1)

## Calculate the density of each
x1dens <- density(x1)
x2dens <- density(x2)

## Set up a plotting region explicitly
plot.new()
plot.window(xlim = c(0,15),
            ylim = c(0,0.5))
range
## function (..., na.rm = FALSE) .Primitive("range")title(xlab = "Value", ylab = "Density", main = "Density Plot")
axis(1)
axis(2)
## Add the data (notice that these do not call plot.new() so will add onto the current figure
lines(x1dens , col = "red")
lines(x2dens , col = "blue")
## Add a legend
legend("topleft", legend = c("Mean = 5", "Mean = 10"), col = c("red", "blue"), lty = 1)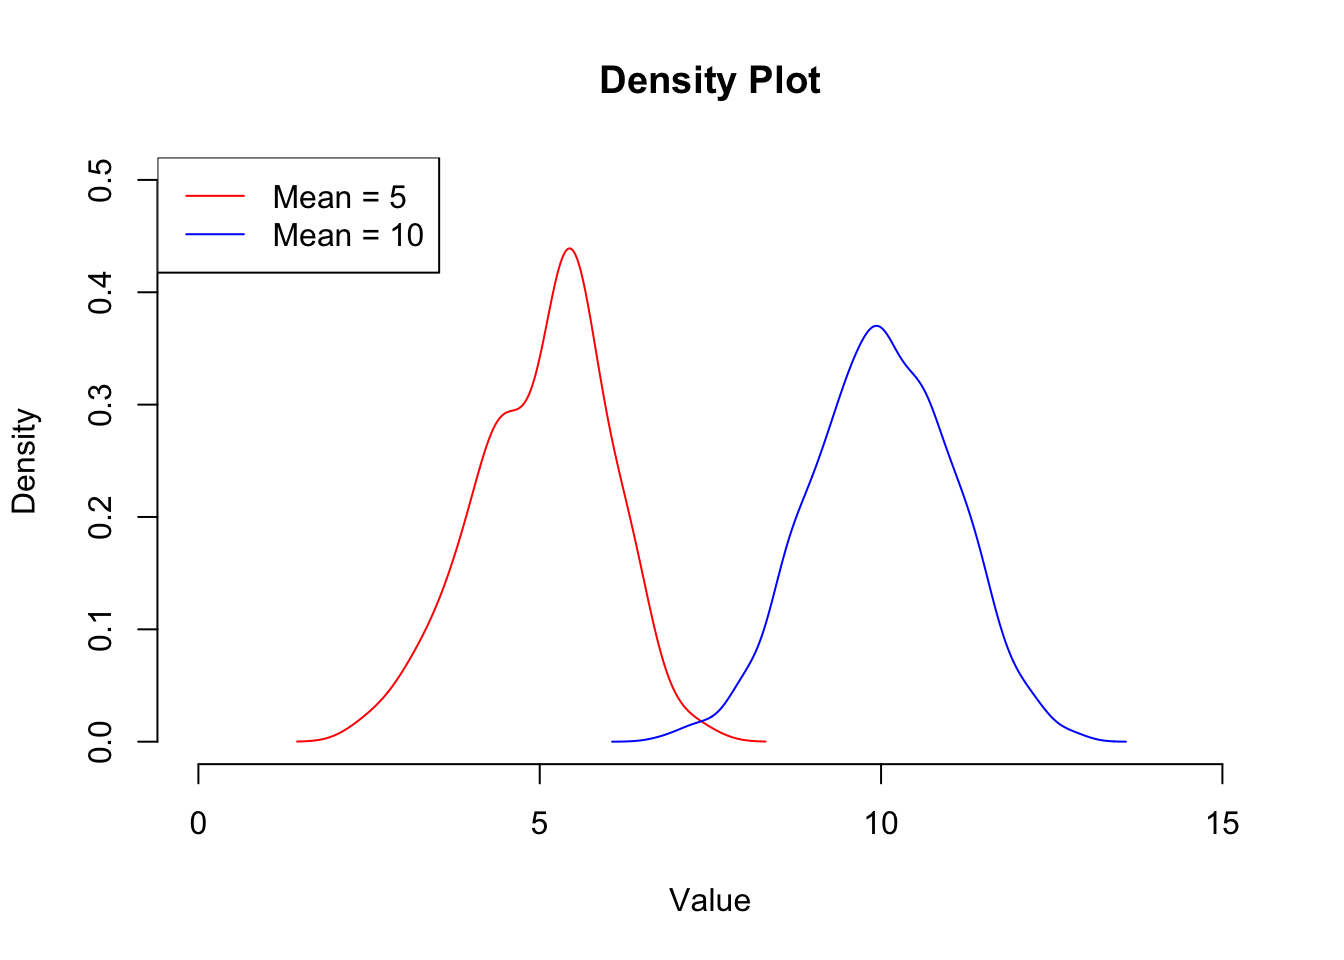
10.6 Boxplots
Another way to compare the distribution of two (or more) data sets is by using a boxplot. A boxplot shows the overal distribution by plotting a box bounded by the first and third quartiles, with the median highlighted. This shows where the majority of the data lie. Additional values are plotted as whiskers coming out from the main box:
boxplot(x1, x2, names = c("Mean = 5", "Mean = 10"), ylab = "Value")
boxplot() can also take the data in the form of a data frame, which is useful for instance if you want to compare the distribution of expression values over all genes for a number of different samples. This will automatically label the boxes with the column names from the data frame:
my_data <- data.frame(Sample1 = rnorm(100),
                      Sample2 = rnorm(100),
                      Sample3 = rnorm(100),
                      Sample4 = rnorm(100),
                      Sample5 = rnorm(100))
boxplot(my_data)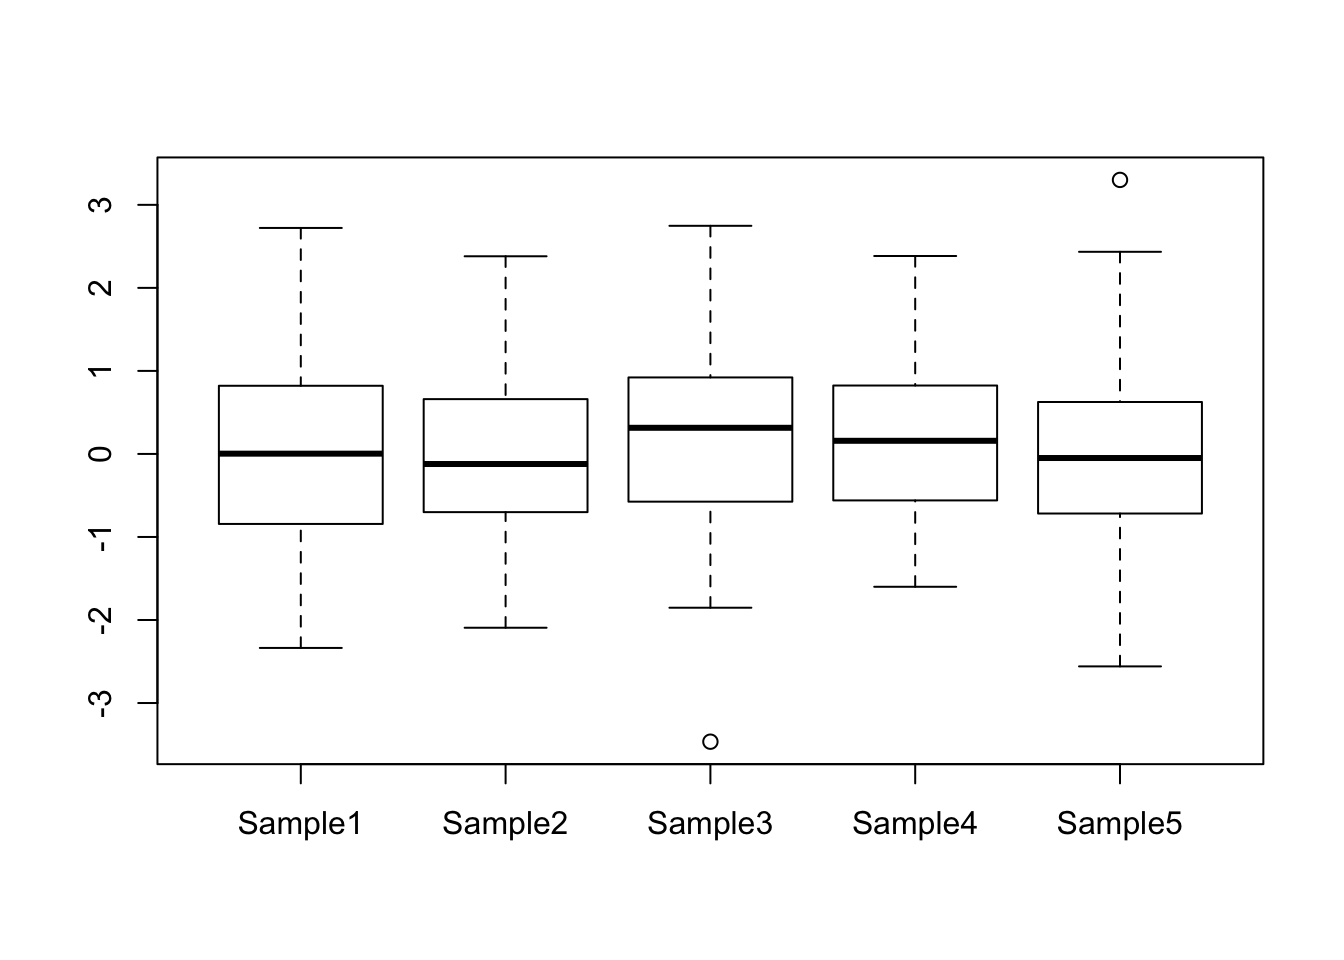
10.7 Bar Plots and Pie Charts
Now let’s say that we have a data set that shows the number of called peaks from a ChIPseq data set that fall into distinct genomic features (exons, introns, promoters and intergenic regions). One way to look at how the peaks fall would be to look at a pie graph:
my_peak_nums <- c("exon"       = 1400,
                  "intron"     = 900,
                  "promoter"   = 200,
                  "intergenic" = 150)
pie(my_peak_nums)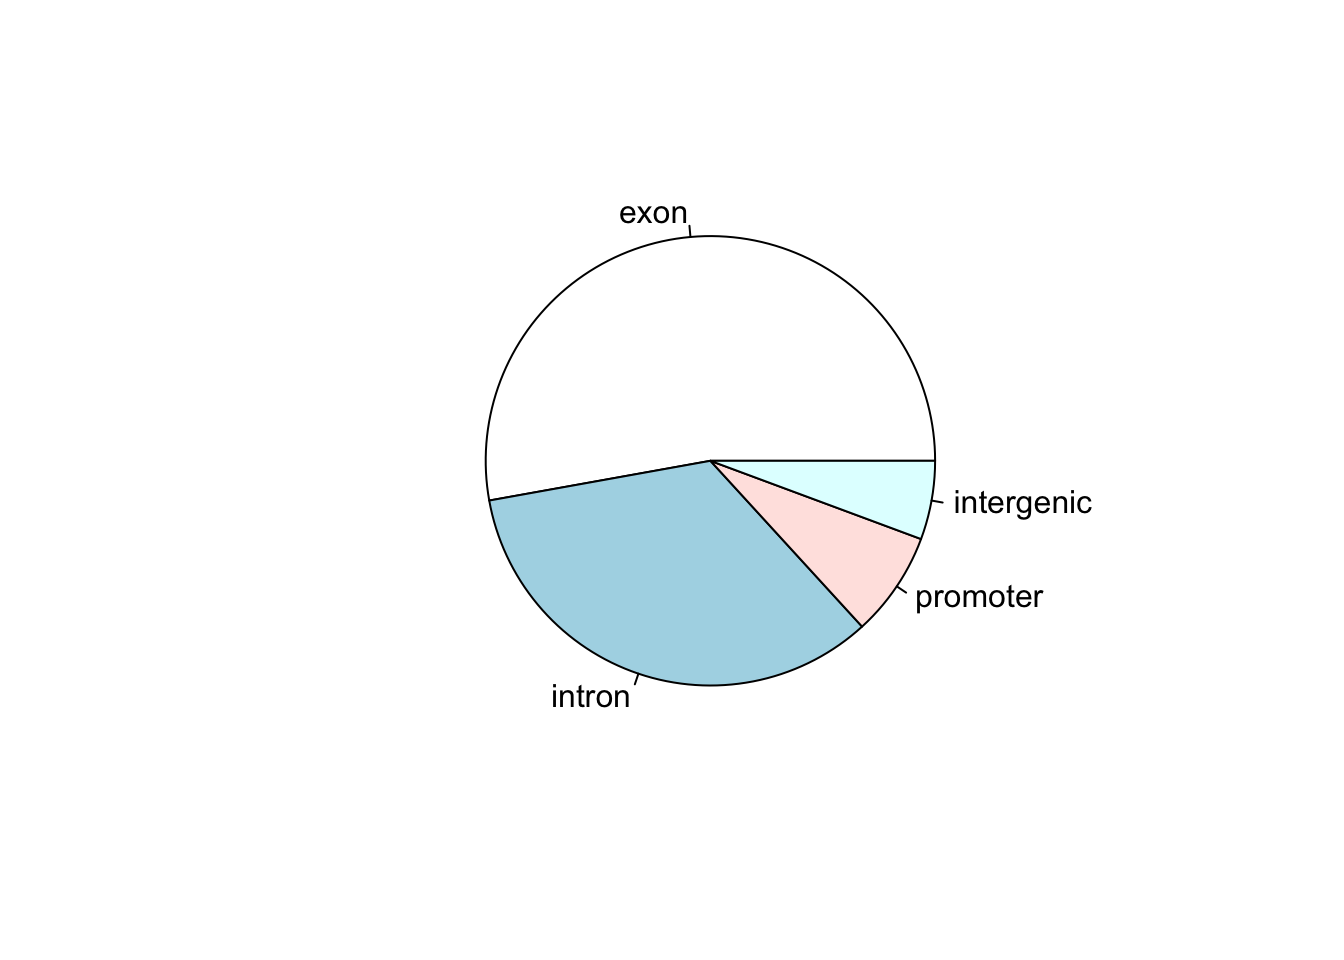
This figure shows that the majority of the peaks fall into exons. However, pie graphs are typically discouraged by statisticians, because your eyes can often misjudge estimates of the area taken up by each feature. A better way of looking at data such as this would be in the form of a barplot:
barplot(my_peak_nums,
        ylab = "Number of Peaks in Feature",
        main = "Peaks in Gene Features")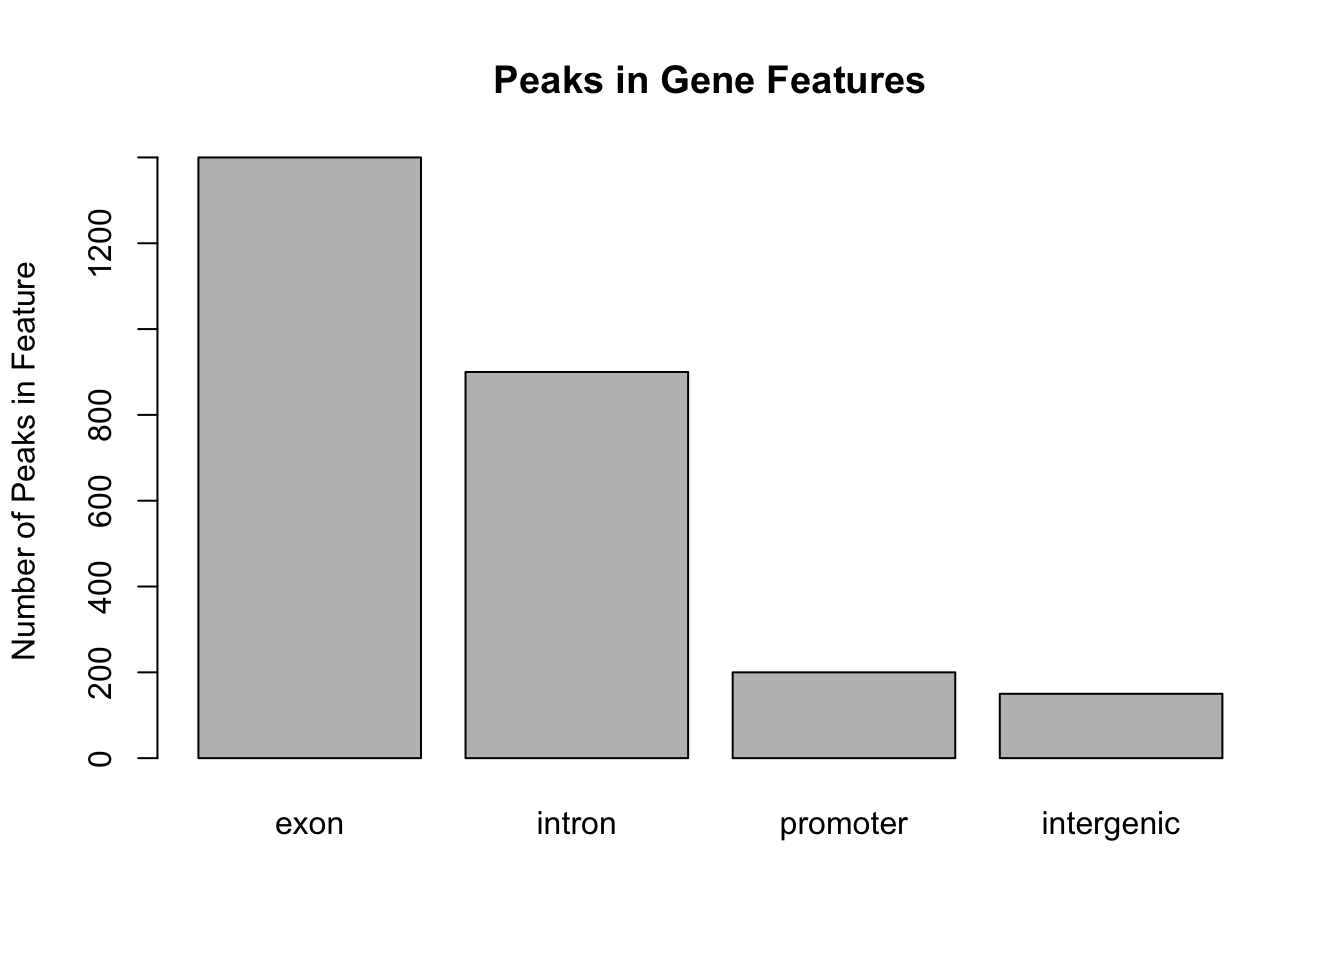
Now let’s suppose that we had data showing the number of peaks in different genomic features for multiple samples. We could plot multiple pie charts:
my_peak_nums <- data.frame(GeneFeature = c("exon", "intron", "promoter", "intergenic"),
                           Sample1 = c( 1400, 900, 200, 150 ),
                           Sample2 = c( 2400, 1000, 230,250 ),
                           Sample3 = c( 40,30, 5,7 )
                           )
par(mfrow = c(1,3))
pie(my_peak_nums[[2]], main = "Sample1", labels = my_peak_nums[[1]])
pie(my_peak_nums[[3]], main = "Sample2", labels = my_peak_nums[[1]])
pie(my_peak_nums[[4]], main = "Sample3", labels = my_peak_nums[[1]])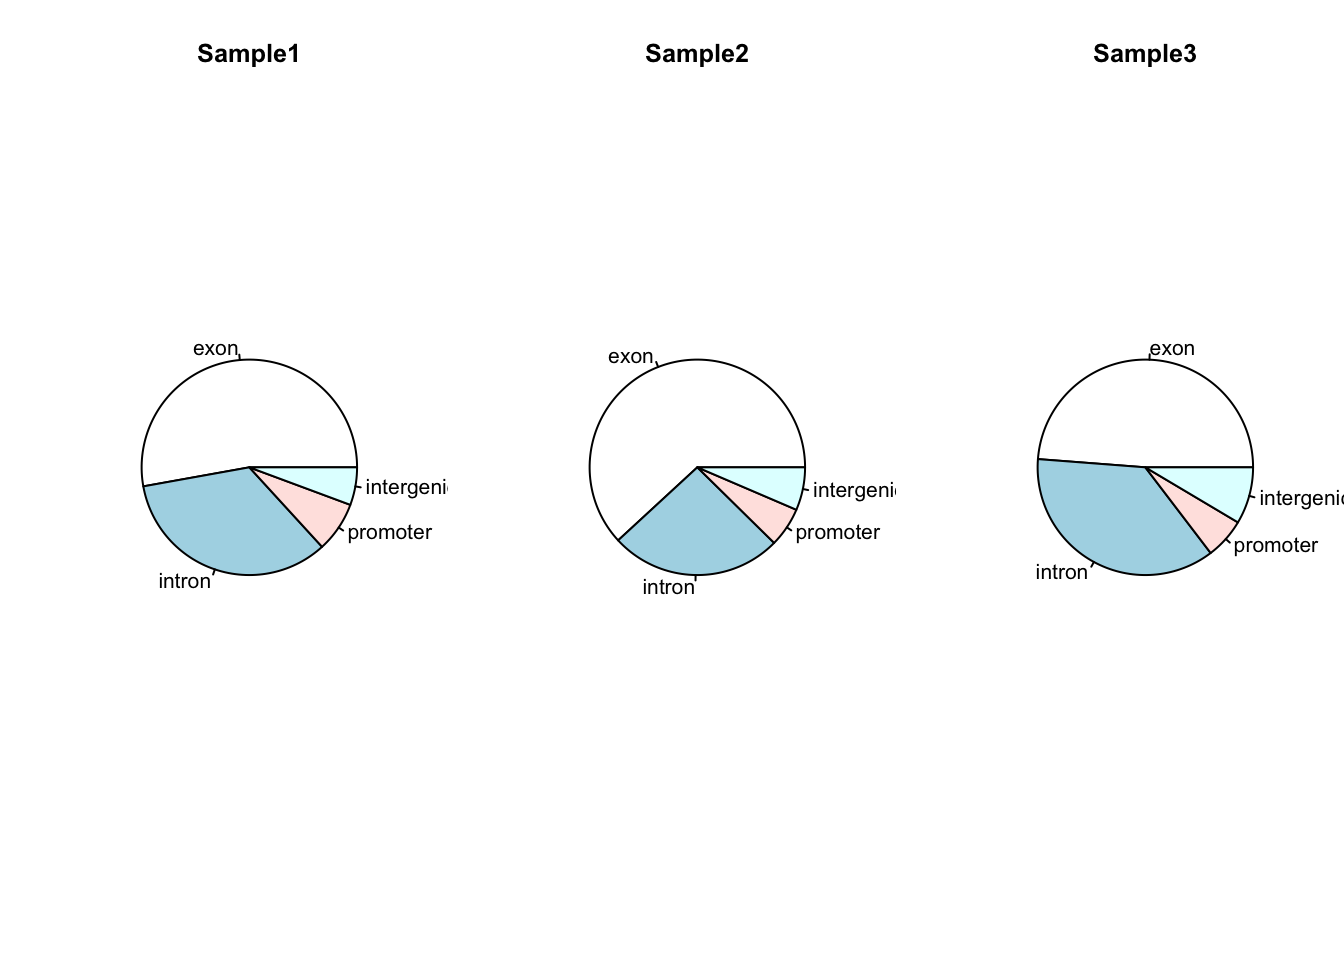
par(mfrow = c(1,1)) ## Reset the plotting regionHowever comparing across multiple pie charts is very difficult. Instead, a single barplot will work better. Note that here the number of peaks is different for each sample, so it makes more sense to convert the data into a format whereby the bar height represents the percentage of peaks within a particular feature:
## Convert to percentages so that the samples are comparable
my_peak_percent <- my_peak_nums[, 2:4]
for (i in 1:3) {
my_peak_percent[[i]] <- 100*my_peak_percent[[i]]/sum(my_peak_percent[[i]])
}
## Convert to a matrix to satisfy requirements for barplot()
my_peak_percent <- as.matrix(my_peak_percent)
## Plot the bar plot
barplot(my_peak_percent ,
ylab = "Percentage of Peaks in Feature",
main = "Peaks in Gene Features",
legend.text = my_peak_nums[["GeneFeature"]])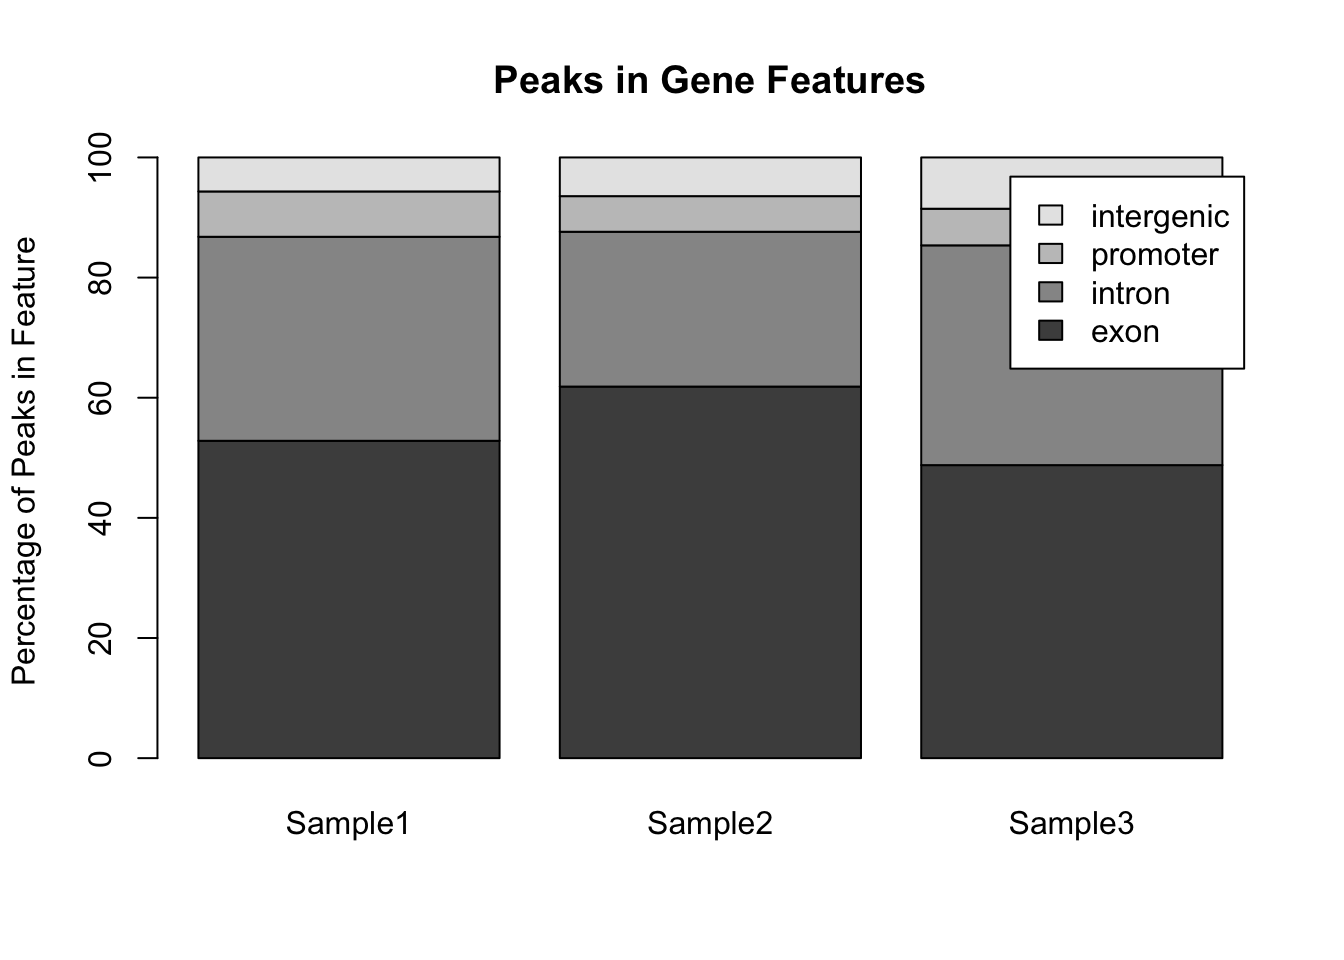 Notice that the default way that
 barplot() works is to plot the bars in a single stack for each sample. This is fine for comparing the exons, but trying to compare the other classes is much harder. A better way to plot these data would be to plot the bars side by side for each sample:
barplot(my_peak_percent ,
        ylab = "Percentage of Peaks in Feature",
        main = "Peaks in Gene Features",
        legend.text = my_peak_nums[["GeneFeature"]],
        beside = TRUE)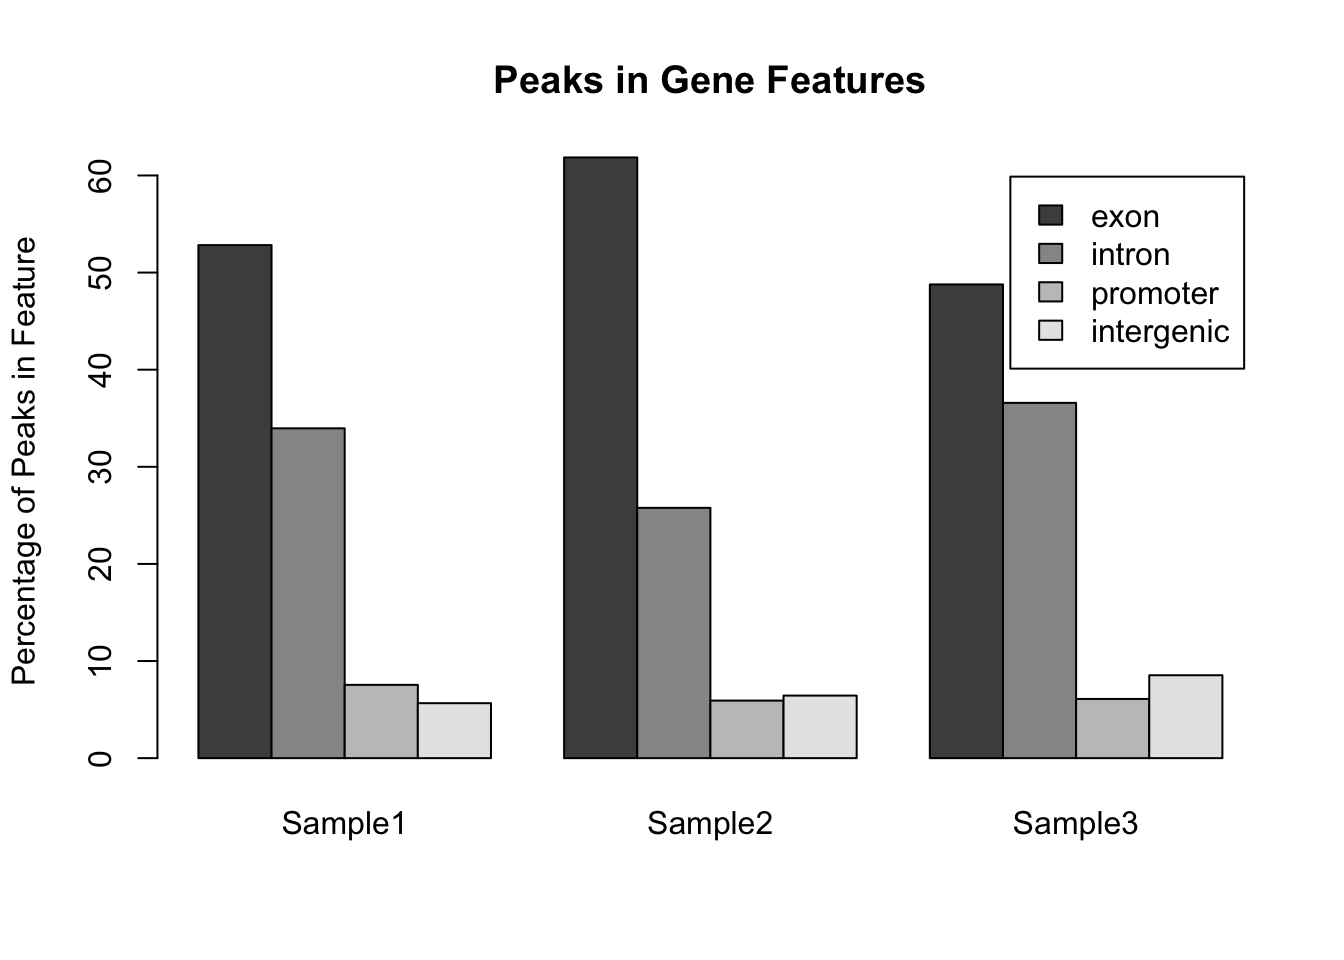
10.8 Graphical Control
That covers the majority of the basic plotting functions that you may want to use. You can change the standard plotting arguments by using the par() command:
par(mar = c(5,10,0,3))  ## Sets the figure margins (in 'number of lines') - b,l,t,r
par(las = 1)            ## Changes axis labels to always be horizontal
par(tcl = -0.2)         ## Change the size of the axis ticks
plot(x = rnorm(100), y = rnorm(100))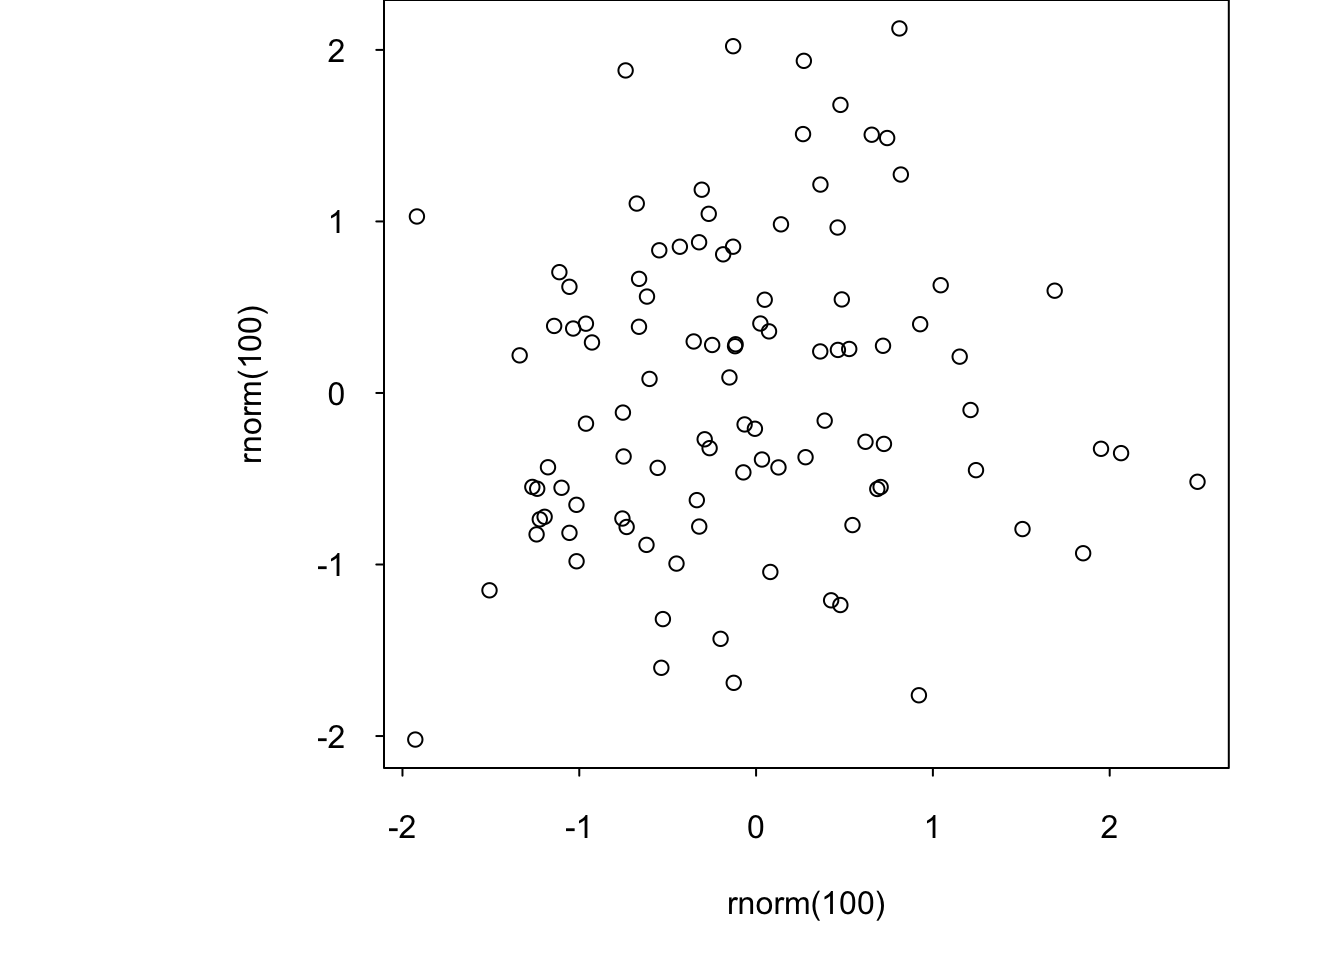
10.9 Subplots
By default, the graphics device will plot a single figure only. There are several ways to create subfigures within this region. The first is to set the mfrow argument in par(). This will split the graphics region into equally sized subplots:
par(mfrow = c(3, 2)) ## Creates a figure region with 3 rows and 2 columns
for (i in 1:6) {
plot(x = rnorm(100), y = rnorm(100))
}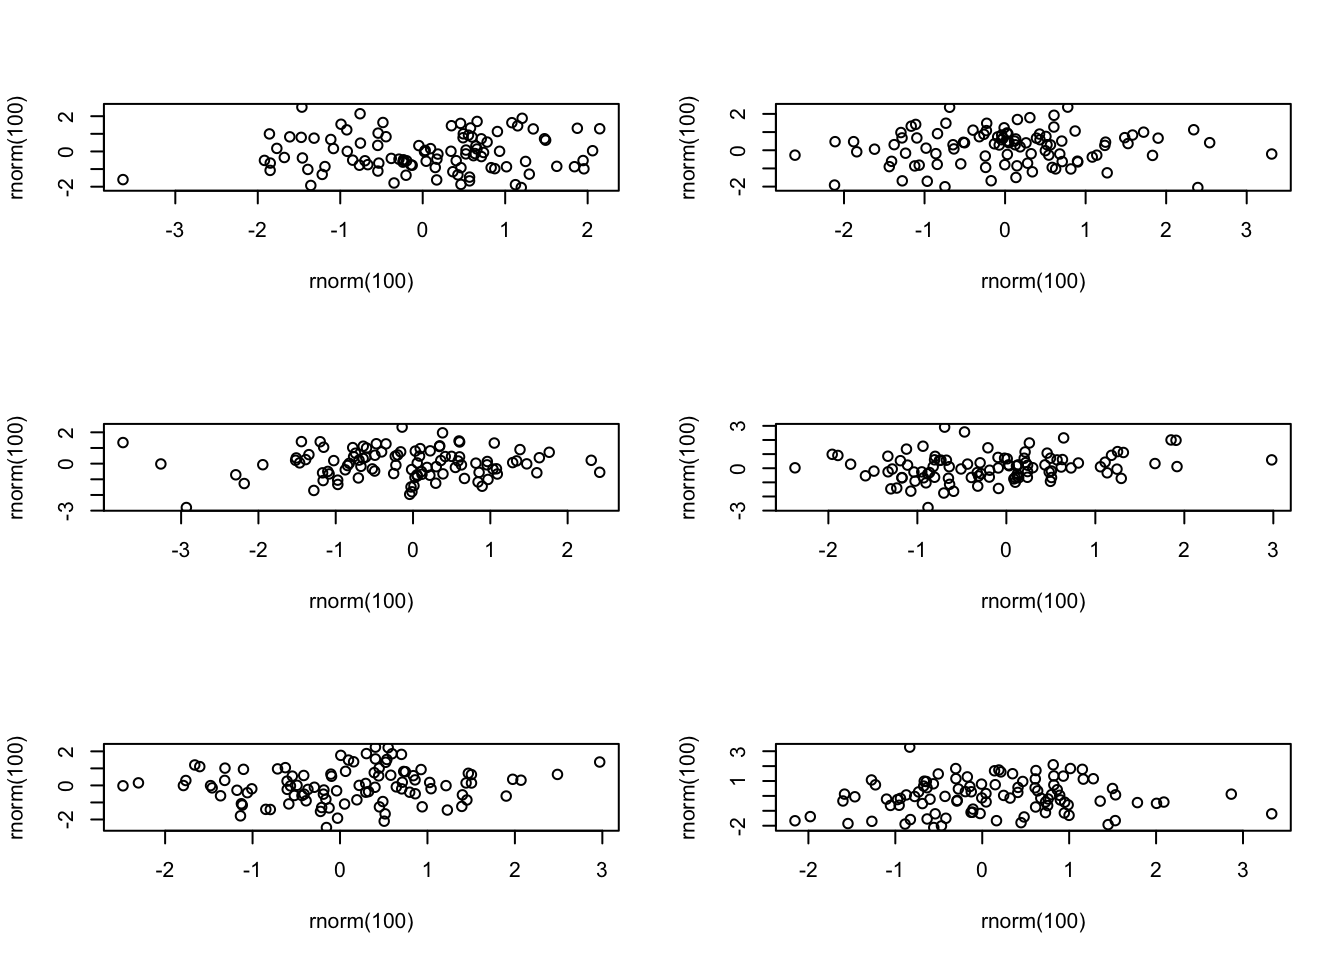 However, if you want more control over your plotting, you can use the
 layout() function which allows you to specify the size and layout of the subplots. This function takes a matrix specifying where in the grid of subplots each plot should be drawn to. So the first call to plot() will put its figure in the grid regions labelled 1, the scond call will put its figure anywhere that there is a 2, etc. Anywhere that you do not want a figure should have a 0. The heights and widths arguments allow you to specify the size of each grid region. You can check what the resulting figure layout will look like by using layout.show(n), where n is the number of subplots in your figure. With a bit of work, you can get some very good layouts:
my_layout <- matrix(c(1,1,1,1,2,2,3,4,2,2,3,4,0,0,3,4,0,0,5,5), nrow = 5, ncol = 4, byrow = TRUE)
layout(my_layout, widths = c(10,10,2,2), heights = c(1,5,5,5,2))
my_layout
## [,1] [,2] [,3] [,4]
## [1,] 1 1 1 1
## [2,] 2 2 3 4
## [3,] 2 2 3 4
## [4,] 0 0 3 4
## [5,] 0 0 5 5layout.show(5) ## Can you see how this matrix leads to this layout? 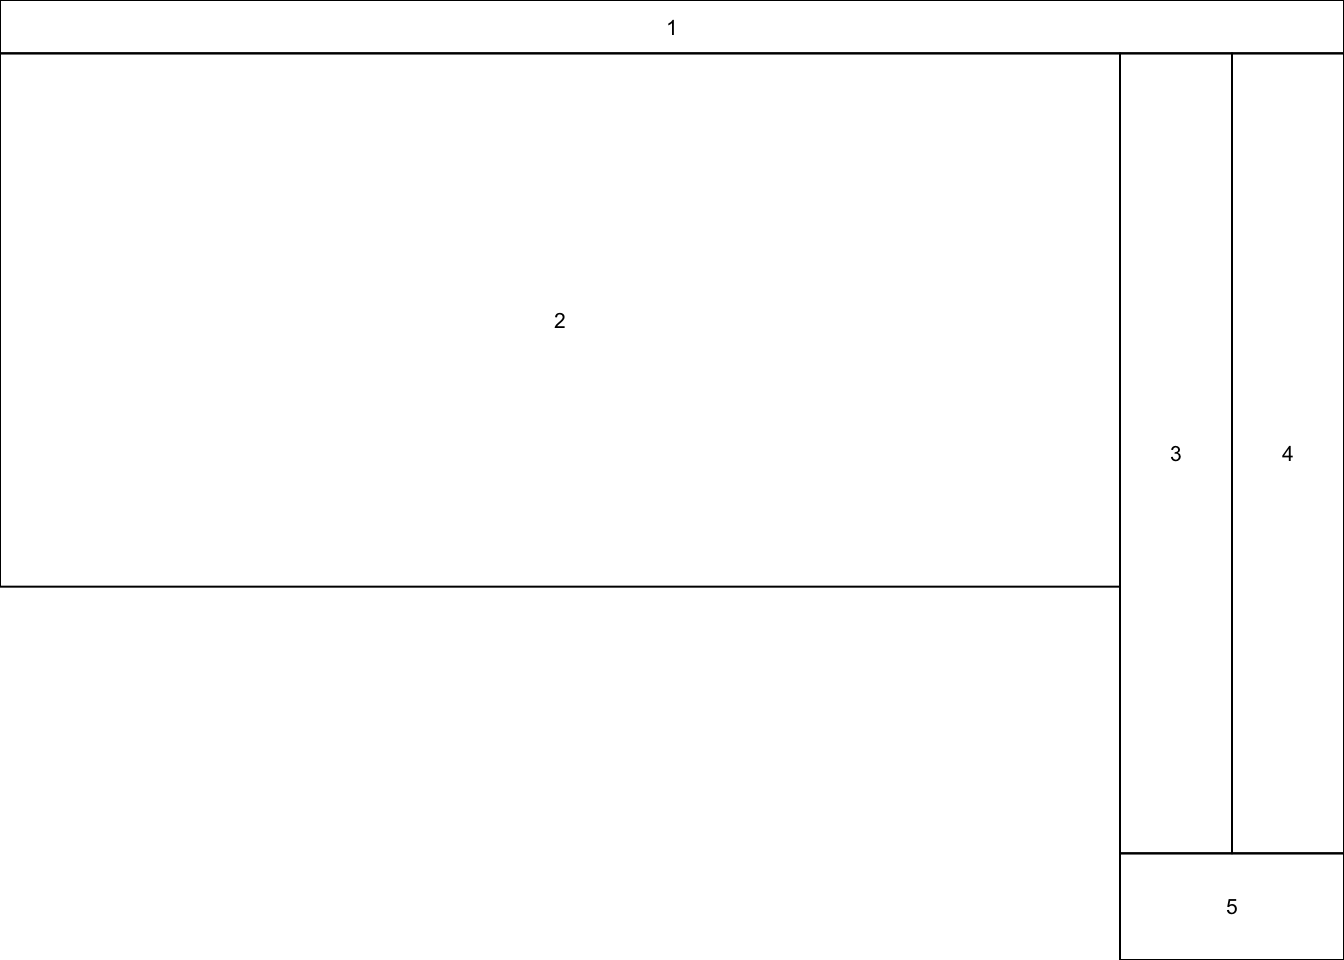
10.10 Saving Figures
By default, figures are generated in a seperate window from R. However, you can save the figure to an external file by using one of the functions png(), pdf(), jpeg(), etc. These functions open a new “device”, which R can use to plot to. After the figure has been plotted, the device must be turned off again using the dev.off() function. There are many arguments that can be used for these functions. In general, these define the dimensions and resolution of the resulting figure. It can be difficult to get these right, so play around to see how they affect things:
png("figures/test_figure.png", height = 10, width = 10, unit = "in", res = 300)
plot(1:10, 1:10, type = "l", main = "My Test Figure", xlab = "x axis", ylab = "y axis")
dev.off()
11 Example Analysis
11.1 Introduction
This is just a simple example analysis to give you an idea of the sort of things that we can do with R. Suppose that we have two experiments, each looking at the effects on gene expression of using a particular drug (“Drug A” and “Drug B”). For each experiment we have two samples; one showing the gene expression when treated with the drug, and the other showing the gene expression when treated with some control agent. Obviously in a real experiment, we would have many replicates, but here we have \(n=1\). We want to do the following:
- For each drug, we want to get the fold change for each gene
- For each drug, we want to identify the genes that are significantly changed when using the drug
- We want to compare the results for Drug A with those from Drug B to find genes that are affected similarly by both drugs
- We want to plot the correlation between the fold change values for the two drugs to see how similar they are
For this, we will need four files. These files are in a tab-delimited text format. They are tables of values where each row is separated by a new line, and each column is separated by a tab character (\t). These files can be created by and read into Excel for ease of use. To avoid errors when reading in files from text, it is good practice to ensure that there are no missing cells in your data. Instead try to get into the habit of using some “missing”" character (e.g. NA).
| File Name | Description |
|---|---|
| experiment1_control.txt | Expression levels for ctrl in expt 1 |
| experiment1_drug.txt | Expression levels for drug A in expt 1 |
| experiment2_control.txt | Expression levels for control in expt 2 |
| experiment2_drug.txt | Expression levels for drug A in expt 2 |
11.2 Load Data
First let’s load in the data:
expt1_ctrl <- read.table("experiment1_control.txt",
                         header = TRUE, sep = "\t",
                         stringsAsFactors = FALSE)
expt1_drug <- read.table("experiment1_drug.txt",
                         header = TRUE, sep = "\t",
                         stringsAsFactors = FALSE)
expt2_ctrl <- read.table("experiment2_control.txt",
                         header = TRUE, sep = "\t",
                         stringsAsFactors = FALSE)
expt2_drug <- read.table("experiment2_drug.txt",
                         header = TRUE, sep = "\t",
                         stringsAsFactors = FALSE)
Use head() to look at the data. Each of these files contains two columns; the gene name and some value that represents the expression level for that gene (assume that these values have been calculated after pre-processing, normalisation, etc.).
In all of these cases, the list of gene names is identical, and in the same order which means that we could compare row 1 from the control-treated file with row 2 from the drug-treated file to get all of the comparisons. However, in a real data set you will not know for sure that the gene names match so I recommend merging the files together into a single data frame to ensure that all analyses are conducted on a gene by gene basis on the correct values.
We therefore create a single data frame for both experiments using the merge() command:
expt1 <- merge(expt1_ctrl, expt1_drug,
               by = "GeneName") ## The 'by' variable tells merge which column to merge
names(expt1)[2] <- "Control"
names(expt1)[3] <- "Drug"
expt2 <- merge(expt2_ctrl, expt2_drug,
               by = "GeneName")
names(expt2)[2] <- "Control"
names(expt2)[3] <- "Drug"
11.3 Calculate Fold Change
Now we calculate the fold change for each gene by dividing the drug-treated expression by the control expression. To avoid divide by zero errors, we can set a minimum expression value. This will also ensure that we are only looking at expression changes between significant expression values. Since we want to do the same thing to both the experiment 1 and the experiment 2 data sets, it makes sense to write a single function to use for both:
get_fold_change <- function (x, min_expression = 10) {
  ctrl_val <- as.numeric(x["Control"])
  drug_val <- as.numeric(x["Drug"])
  ctrl_val <- ifelse(ctrl_val <= min_expression, min_expression, ctrl_val)
  drug_val <- ifelse(drug_val <= min_expression, min_expression, drug_val)
  return(drug_val/ctrl_val)
}
expt1[["FoldChange"]] <- apply(expt1, MAR = 1, FUN = get_fold_change)
expt2[["FoldChange"]] <- apply(expt2, MAR = 1, FUN = get_fold_change)
11.4 Compare Data
Now let’s find the genes that are upregulated and downregulated in each experiment. Due to the lack of replicates, we do not have any estimate for the variance of these genes, so we will have to make do with using a threshold on the fold change:
fold_change_threshold <- 1.5
expt1_up   <- subset(expt1, FoldChange >= fold_change_threshold)[["GeneName"]]
expt1_down <- subset(expt1, FoldChange <= 1/fold_change_threshold)[["GeneName"]]
expt2_up   <- subset(expt2, FoldChange >= fold_change_threshold)[["GeneName"]]
expt2_down <- subset(expt2, FoldChange <= 1/fold_change_threshold)[["GeneName"]]
cat("Upregulated in Experiment 1:",   paste(expt1_up,   collapse = "\n"), sep = "\n")
## Upregulated in Experiment 1:
## gene12
## gene8cat("Downregulated in Experiment 1:", paste(expt1_down, collapse = "\n"), sep = "\n")## Downregulated in Experiment 1:
## gene32
## gene46cat("Upregulated in Experiment 2:", paste(expt2_up, collapse = "\n"), sep = "\n")## Upregulated in Experiment 2:
## gene18
## gene50
## gene8cat("Downregulated in Experiment 2:", paste(expt2_down, collapse = "\n"), sep = "\n")## Downregulated in Experiment 2:
## gene22
## gene43So we now have the genes that change when each of the drugs is used. But now we want to compare the two drugs together. First, let’s see if there are any genes similarly affected by both drugs. We can do this using the intersect() function which gives the intersect of two lists:
common_up   <- intersect(expt1_up, expt2_up)
common_down <- intersect(expt1_down, expt2_down)
cat("Upregulated in Experiment 1 and Experiment 2:", paste(common_up, collapse = "\n"), sep = "\n")
## Upregulated in Experiment 1 and Experiment 2:
## gene8cat("Downregulated in Experiment 1 and Experiment 2:", paste(common_down, collapse = "\n"), sep = "\n")## Downregulated in Experiment 1 and Experiment 2:So we can see that only one gene is similarly affected by both drugs (“gene8”). Now let’s plot a figure to see how the fold change differs between the two drugs:
fold_change_data <- merge(expt1[, c("GeneName", "FoldChange")],
                          expt2[, c("GeneName", "FoldChange")],
                          by = "GeneName")
names(fold_change_data)[2] <- "Experiment1"
names(fold_change_data)[3] <- "Experiment2"
plot(x = log2(fold_change_data[["Experiment1"]]),
     y = log2(fold_change_data[["Experiment2"]]),
     pch = 19,
     xlab = "log2(Experiment1 Fold Change)",
     ylab = "log2(Experiment2 Fold Change)",
     main = "Experiment1 Fold Change vs Experiment2 Fold Change",
     cex.lab = 1.3,
     cex.axis = 1.2,
     cex.main = 1.4,
     xlim = c(-2,2),
     ylim = c(-2,2)
     )
abline(h = 0)
abline(v = 0)
abline(a = 0, b = 1, lty = 2)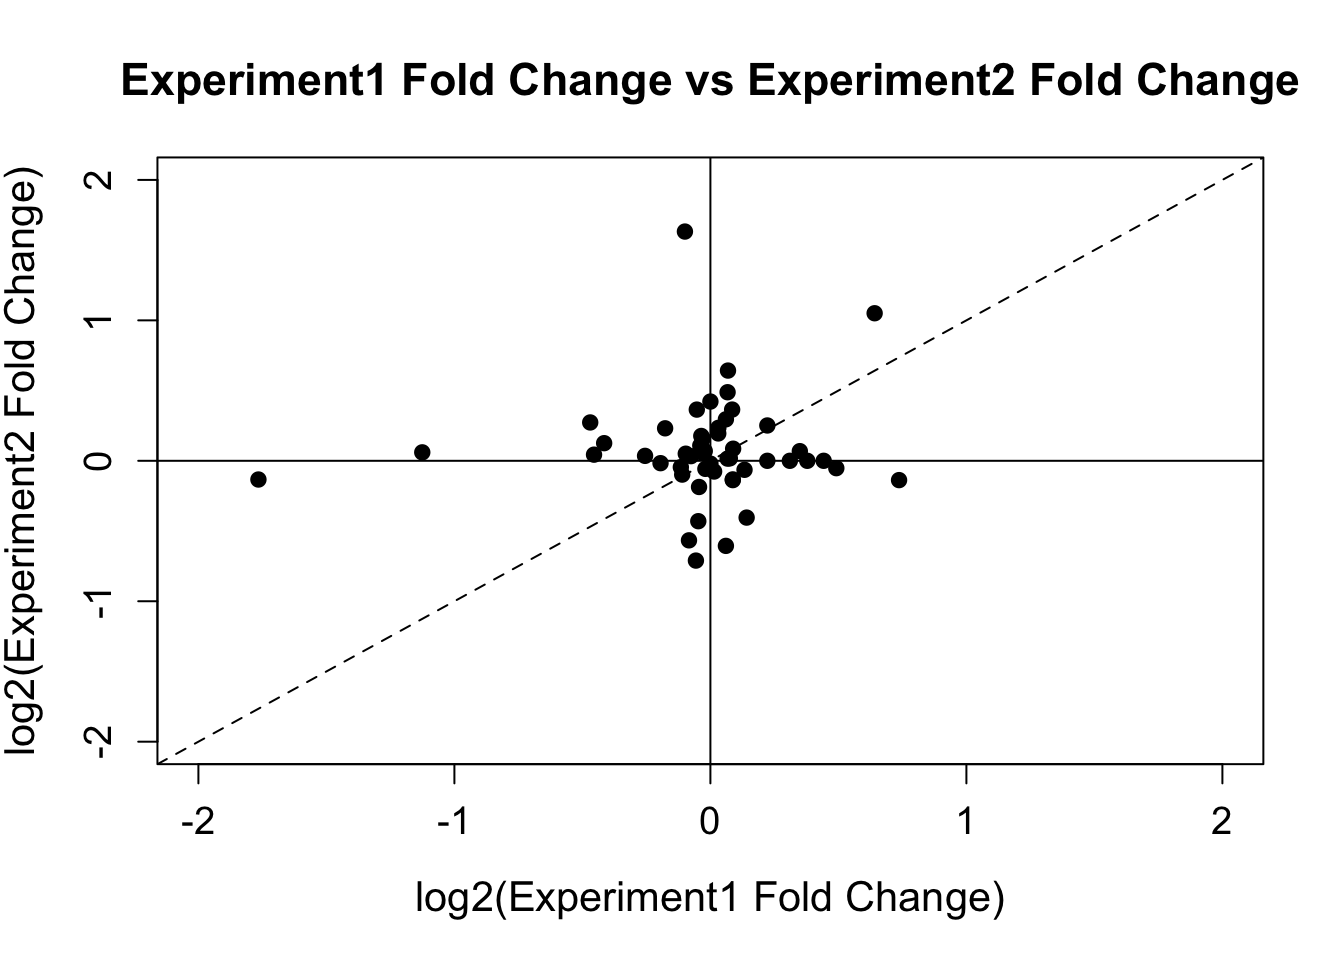
This figure shows that the effect on the gene expression is actually quite different for the two drugs. We can also see this by looking at the correlation between the two experiments:
cor(x = fold_change_data[["Experiment1"]],
    y = fold_change_data[["Experiment2"]],
    method = "pearson")
## [1] 0.08381614cor(x = fold_change_data[["Experiment1"]],
y = fold_change_data[["Experiment2"]],
method = "spearman")## [1] -0.02618115Sam Robson
Lead Bioinformatician at the Centre for Enzyme Innovation
Lead Bioinformatician at the Centre for Enzyme Innovation